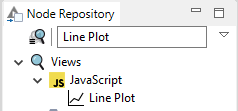
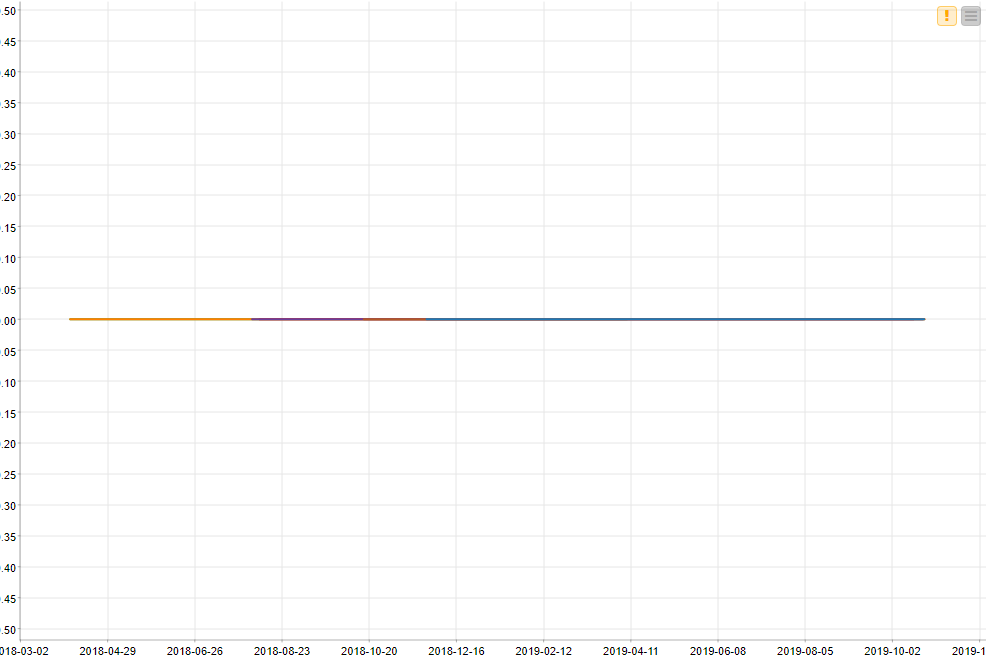
I am trying to achieve Line Plot using more than two columns. When i use one column on X-axis and the others on Y-axis.
It is taking proper data of first column which i have chosen on X-axis. But the same is not happening with the other columns with respect to Y-axis. The data which is present in the table column is not showing on Y-axis.
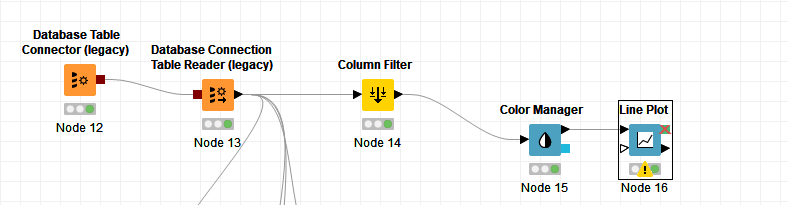
Also, the multiple lines which are plotting are overlapping/overwriting. I have referred the example given. (02_Example_for_JS_Line_Plot_Basic)
But left with no solution. I am trying hard since so many days.
Hi Iris,
Thanks for your reply!!
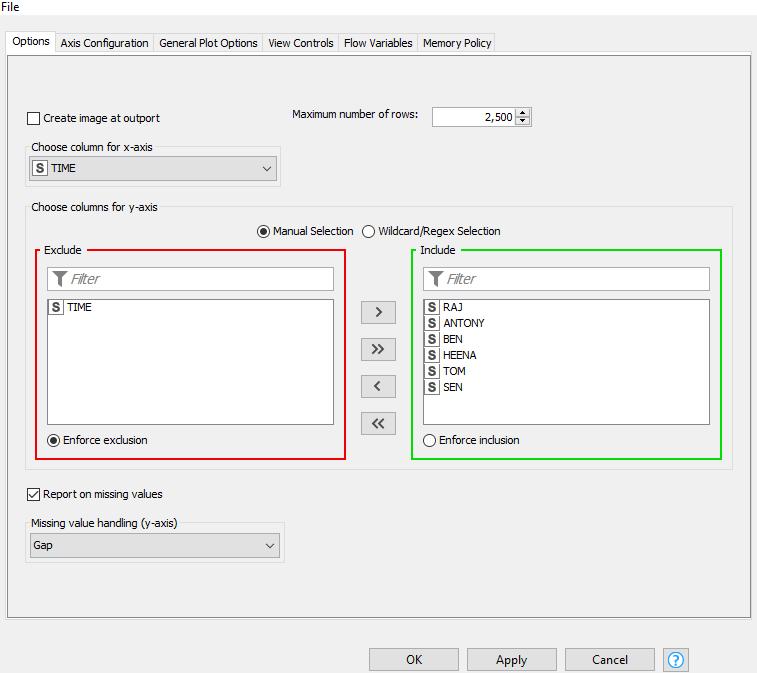
In Y-axis columns, the data values are not numbers which i have shown in the image, instead those are string values. In that case, whether “String To Number” will work, can u please confirm.
No this only works for numbers. in this case, the line plot will not work, as it needs a numerical Y Axis.
Maybe another visualization is than better? What do you want to achieve?