Hello @rogerius1st
Looking at these charts in .docx that you shared, it’s hard to deliver some conclusions. Even I would say -unknowing the context-, that these chart views aren’t really standard, thinking about an outstanding paper.
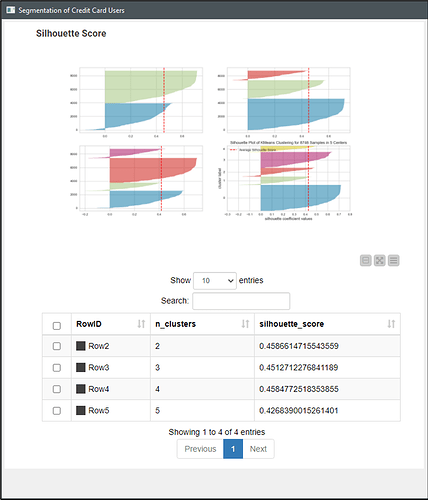
I don’t know if you are familiarized with Py coding. Then, I would try to script it, aiming to get some standard charts and silhouette rates for your paper. The chart appearance and rating I’m suggesting should look like this (targeting to be more interpretable):
You would be able to find Py templates in the following topic. This example in the picture is submitted together with the ones from other JKI colleagues:
BR
