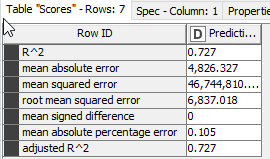
I am only starting to use KNIME so this is a fairly basic question. I am using the Linear Regression Learner node and it appears to work as intended. However, when I add the numeric scorer node, the results do not match what the regression node shows. The scorer says the R2 =1 but it does not. I don’t understand why the numeric scorer does not seem to be showing what the regression is showing. Also, none of the regression output appears to show the number of observations - is there a node I should be using that would show more complete output from the regression model?
welcome to the KNIME community.
It´s kind of hard to pinpoint your problem without a workflow and data.
Without it my only explanation would be that configuration in the scorer node maybe of.
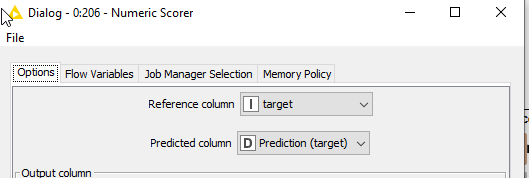
Maybe reference column and prediction column are the same? They have to be different:
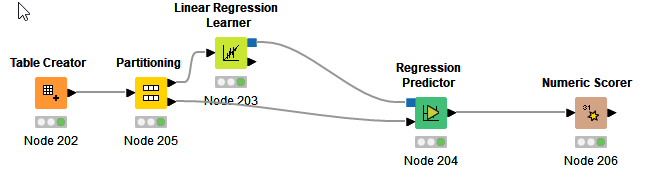
Else you only have to use the learner, predictor and scorer node:
Thank you, that is part of what I am missing. I didn’t realize I needed the Predictor before using the scorer but I now added that and changed the column references. But I keep getting an error about missing data from the scorer. I replaced all the missing data in my workflow with averages for those variables. The confusing thing is that my regression predictor is showing 2041 rows (which is correct) and the error in the Numeric Scorer says
“Execute failed: missing value in prediction column in Row 2900_Row24877”
I don’t understand where those row numbers are coming from.
I can’t upload the files. First, they are .csv and that file type is not supported for upload (why?). So, I saved them as .xlsx but the file sizes are too large to upload. So, I can’t provide the data. I don’t know what you mean by “don’t reset your workflow before uploading it.”
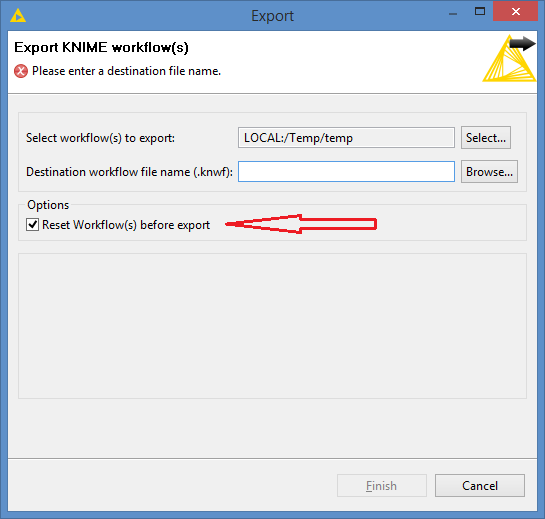
Hi @dlehman , one way of sharing the data for your workflow is to execute the workflow, or at least the node that contains your data (you should see the nodes in the “green” state), save it as it is, and then export the workflow. While exporting, you should UNCHECK this option:
It’s checked by default, and when it’s checked, it will reset the workflow for export and the data will NOT be included.
What’s what @goodvirus meant by “don’t reset your workflow before uploading it”
In terms of uploading csv, you can rename the file to .txt (csv files are txt files, it just indicates that they are Comma Separated Version (CSV) files. I think .txt files are allowed to be uploaded
Thank you. Attached is the exported workflow. I had to eliminate a large number of (unused) rows in one of the data files to stay within the upload limit, but I reran it and exported it without resetting. KNIME workflow for video.knwf (3.5 MB)
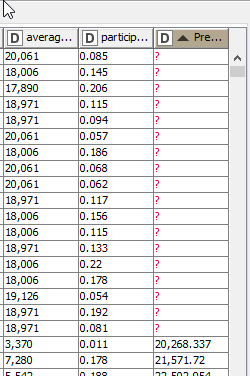
so I found the error. The message: ERROR Numeric Scorer 4:10 Execute failed: Missing value in prediction column in row: Row2900_Row7402 is correct:
As to why that is, the Missing Value Node gives the following warning:
Column “Men’s Team Average Annual Institutional Salary per FTE” still contains missing values.
Column “Women’s Team Average Annual Institutional Salary per FTE” still contains missing values.
Column “Unduplicated Count Men’s Participation” still contains missing values.
Column “Men’s Team Average Annual Institutional Salary per Head Coach” still contains missing values.
Column “Men’s Team Number of Head Coaches Included in Average” still contains missing values.
Column “Men’s Team Number of FTEs Included in Average” still contains missing values.
Column “Men’s Team Recruiting Expenses” still contains missing values.
Column “Classification Name” still contains missing values.
Column “MD_EARN_WNE_P10” still contains missing values.
Column “Total Men’s Team Operating Expenses” still contains missing values.
Column “Total Women’s Team Operating Expenses” still contains missing values.
Column “Unduplicated Count Women’s Participation” still contains missing values.
Column “Women’s Team Average Annual Institutional Salary per Head Coach” still contains missing values.
Column “Women’s Team Number of Head Coaches Included in Average” still contains missing values.
Column “Women’s Team Number of FTEs Included in Average” still contains missing values.
Column “Women’s Team Recruiting Expenses” still contains missing values.
Column “TUITIONFEE_IN” still contains missing values.
Column “TUITIONFEE_OUT” still contains missing values.
Column “Total Men’s Team Revenue” still contains missing values.
Column “Total Women’s Team Revenue” still contains missing values.
Column “Total Men’s Team Expenses” still contains missing values.
Column “Total Women’s Team Expenses” still contains missing values.
Column “AVGFACSAL” still contains missing values.
So what happens is, that your regression learner ignores the missing values
Thanks for looking at this. It raises some questions. Most of those missing values are not used in the regression model, so I don’t know why it matters. A couple were used in the model, so I tried the missing value filter you suggested but I get the same error message about missing values - although when I look at the table, the missing values appear to be filtered out as I wanted.
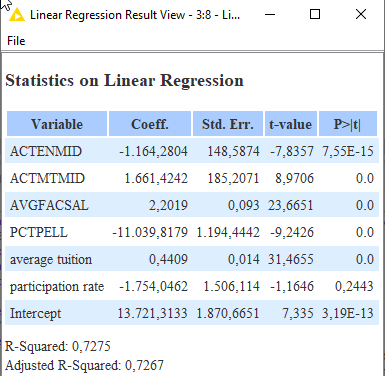
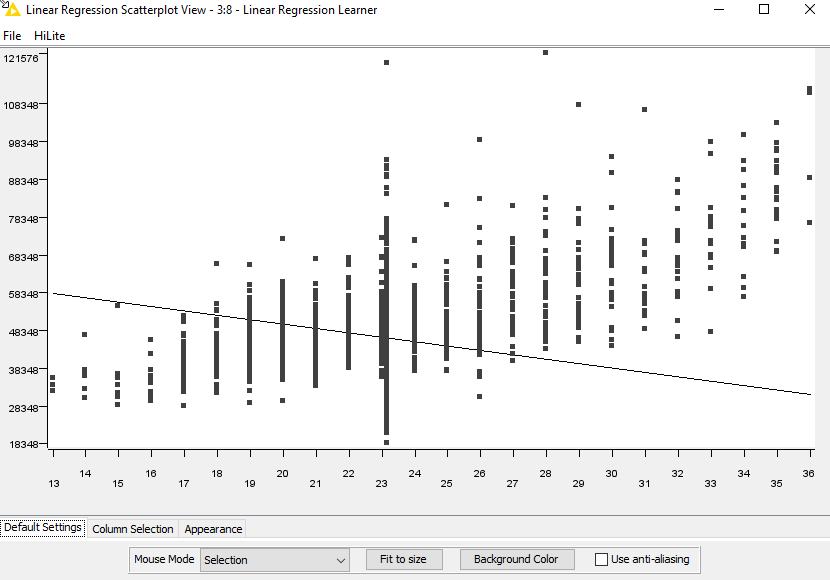
What I really was looking for was a better display of the results from the regression model. Perhaps the numeric scorer is not the best node to use for that? In fact, I haven’t seen anything that provides the number of observations used in the regression model. The model results appear to be what I expected, including the scatter plots, but I was looking for a better display of the summary of fit, parameter values, statistical significance, sample size, etc.
I am well aware of appropriate modeling and the use of validation. This model is simply a demonstration model of how the pieces of a KNIME workflow fit together, not an attempt to demonstrate good modeling practice.
Can you suggest options for viewing the regression model results?
One other question. I see the missing data from the image you attached - but I don’t understand the row numbers. There are not that many row numbers in the data set, so why are the row numbers for the errors so large?
@dlehman I tried two things. Clean up and calculate the Regression with the data you provided. It will result in some missing values in the prediction which would have to be removed and like has been mentioned doing it without proper splitting will do you no good.
I used some H2O.ai auto-machine-learning which via R also provides with a variable importance list. You might see for yourself which variables are worth exploring and which might be some sort of leak. The results are in a subfolder /model/validate/ of the workflow.
If you want to explore more tradition Regression models you might take a look here: