MEDICAL DATA

Hi!

I am trying to build a predictive model. For that I am dealing with patient’s voice. I am introducing in the dataset 2500 features (columns) for each patient. These 2500 columns correspond to the amplitude of frecuency of a vowel. So the first column correspond to the amplitude of 0.5 Hz, the second amplitude to 1 Hz, the third to 1.5 Hz and so on. So it corresponds to values succesive in frecuency.

Is there any way that I can analyse this data properly? Is there any predictive model more appropiate to this type of data?

@helfortuny I think you would have to tell us more about the data and what it is you want to know. Is this a true/false question, or a multi-class or a regression (numerical target). What is the supposed outcome? How many patient data do you have? Do you know anything about the quality of the data?.

One first step to investigate could be to compile a report and inspect the data with regard to the target variable. I like to employ sweetviz for that although since we are a KNIME forum there also is a KNIME solution for that :slight_smile:

Then the question of the model which might depend on the answer to the above question. I have two articles about data preparation (vtreat) and comparison of some typical models (also LighGBM) which could give you a quick glance - but best to first establish what kind of data you have and what your (business) question is. Also what kind of precision you would expect (depending on what you want to do with the data later).

Other methods of dimensionality reduction might also be considered.

If you want to learn more about your your data you could think about techniques like t-SNE that could help to detect new patters in your data (if that is also a question).

3 Likes

Thanks!!!

My target column is a true/false question. My study aims to correlate the voice of a person with the anatomy of the vocal chords. So my target column is the difficulty to see the vocal chords or not in a patient duing surgery. So I should build a classification model.

I have registered 300 patients to do this study. The patients have recorded their voice. They have recorded 5 vowels in 3 different positions. So in total they have registered 15 vowels. From each vowel signal, a preprocessing has been carreid out with MATLAB. I have extracted for each vowel the same number of samples. And with each signal, I have extracted the frecuency spectrum (which can be related with the anatomy of the vocal chords). The ampltiude of the frecuency (equally-spaced data) is what I have in my dataset. I have 2500 features corresponding to the amplitude spectrum of each vowel. So in total I have for each patient 37500 features related to the amplitude spectrum (2500 for each vowel x 15 vowels). All of them they are continous numerical values (double type).

Furthermore, I have registered descriptive characteristics for each patient like age, weight, height, if he smokes or not, etc. They are introduced as discrete values (integers).

From now on, I have grouped all the amplitude frecuency values (300 rows x 37500 features) and I have normalised this magnitude from 0 to 1. I have also normalised the descriptive features separetely (also from 0 to 1). With that, I have tried different classification models (K-nearest Neighbours, Navie Bayes, Neural Network, Random Forest and Gradient Boosting). The results is that none of the models is appropiate to detect the patients who are difficult to see the vocal chords during surgery.

I think that some models require more preprocessing of data, specially for the continous numerical data. There are too much features I guess. But i don’t know how to treat this data in order to detect patterns in amplitude spectrum of a vowel. And compare if the variation of this pattern among patients can be significant to detect the difficult ones. Or maybe the variation of the amplitude frecuency pattern of a vowel compared with two positions in the same patient can be significant and detect if that patient is difficult.

Do you know how can I do this analysis for this type of continous numerical data?

@helfortuny this sounds like an interesting study. These things come to my mind:

You indeed have a lot of variables that will need some preprocessing. One thing you could try is read about vtreat [you can find KNIME workflows for that here] and try that with your target and see what recommendations would be made to see if it makes any difference. You might have tried and removed highly correlated variables. At the end of the vtreat article there are links to other dimension reduction techniques you might want to explore, namely PCA. This would reduce your numbers but also obscure what is in such a component.

How is the quality of your data. Since it is specifically generated I assume the quality is quite good, but you should check for columns with many missings.

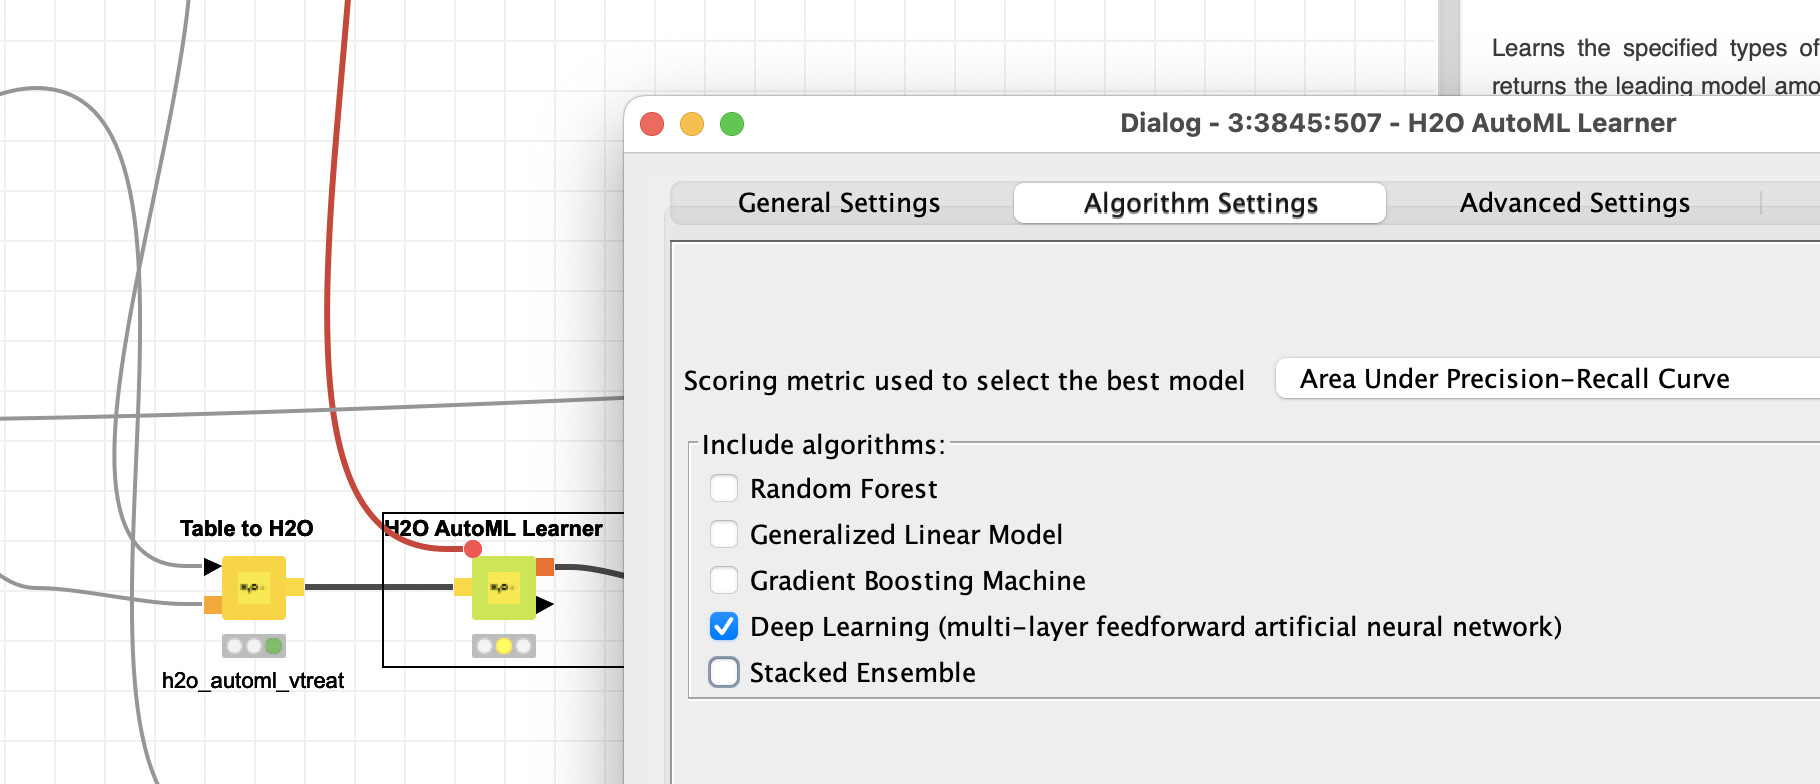
Then: out of the 300 cases how many are ‘positiv’? How unbalanced is your dataset? If it is very unbalanced you might find it difficult to get good results. In any case you might want to use AUCPR or LogLoss as your evaluation metric to focus on your true cases (XGBoost Predictor - #5 by mlauber71).

Your descriptive variables (age …) might not be used because of the massive amount of other data. You could try target encoding and then normalisation if you expect these features to have a permanent influence and your sample might well represent your future patients.

Then about normalisation: a simple transformation into 0-1 might not be sufficient if you have a very wide range of values, smaller differences in numbers in a lot of cases might get obscured by a few very large values. You could try and use logarithm to keep the ‘shape’ (and rank) but lift the lower numbers up or decimal scaling (available in the KNIME node).

Concerning models: For a lot of cases I prefer to use robust tree models (GBM, XGBoost, LightGBM) and boosters and auto-machine learning approaches. For such large numerical tasks if you cannot find a good approach there might be a case to try deep-learning.

One way to determine if deep-learning might be able to help would be to use the H2O.ai AutoML node and just let it run deep-learning approaches in one branch to see if this can beat your other approaches.

Since this is a KNIME forum you might want to explore its opportunities. DL models will present a challenge of their own - starting with finding a good model architecture. But there is a book that might be worth reading - you can also search for videos from the authors.

https://www.knime.com/codeless-deep-learning-book

1 Like

@helfortuny

As you have already noted 2,500 features is too many for sensible analysis. Reading your explanation, I understand you have the audio waveform for each of your patients which you have converted from the time-domain to the frequency-domain which is the 2,500 features. I am guessing that this represents the power spectral density of the waveform in 5hz steps from say 100hz up to 7,600hz.

I would suggest you need to convert this data to identify the patients base frequency and harmonics. I am reasonably assuming you know the the vocal chords resonate to to produce the harmonics which are then modified by the formants. The formants will alter the energy of each harmonic.

As the harmonics produced by each patient will vary according to the pitch of their voice you need to extrapolate from your 2,500 the power for each harmonic. This will give you a data set of 10-15 samples each sample representing the power of each harmonic. I haven’t given much thought how to do this in KNIME, it might be easier to do it in MATLAB.

Once you have the harmonics you can plot all the patient data for one vowel and mouth opening. Perhaps a box plot or violin plot where the categories across the bottom are harmonics, the vertical axis is the power of each harmonic. If you do two plots one with and one without blockages and compare you might see some differences which indicate which tools help drive a prediction model.

I suggest you use these features for your machine learning task. Any damage to the vocal chords will change the tone of the voice (the relative power of each harmonic) which is then further altered by any resonant chambers/ blockages in the vocal tract. I am guessing that you are looking for characteristic changes in the ratio of the harmonics to drive your prediction algorithm

Once you have the power for each harmonic as a feature, along with the demographic and physical data, then the techniques you have suggested should yield more successful results.

DiaAzul
LinkedIn | Medium | GitHub

2 Likes

@DiaAzul Thank you for your answer! Very helpful.

However, I have a doubt. You suggest to extract the frecuency power of the harmonics of the signal. In this case, you only have information about the Y-axis of the frecuency domain of the signal, but not about the X-axis of the frecuency domain. In other words, you don’t take into account the frecuency at which harmonic corresponds. Don’t you think that this might skip relevant information for the model?

@helfortuny

The pitch of each persons voice will vary from person to person, and may even vary from sample to sample for the same person. Therefore, absolute frequency will vary across the samples and make it impossible to extract any meaningful information. By normalising the frequency information to the harmonics it may be easier to identify patterns between patients. I say may be because this is untested and is one avenue for you to explore.

The following sketch illustrates what I am trying to achieve. Two samples purple, green. Their frequencies are different (the pitch of the voice), however, by identifying the power of each harmonic it is possible to align the harmonics and compare them between samples. The difficult is that the harmonic power is probably spread across several of your samples so determining the power of a harmonic will need some effort. It’s not an easy task.

4 Likes

Wooow you’re a genius! Thank you. I’ll try and give you the feedback!

2 Likes

Shouldn’t I be using more features as power spectra? Imagine that a patient has a fundamental frequency of 100 Hz. Then, the harmonics are found in 200, 300, 400 Hz, etc. Imagine that I extract the first 15 harmonics. Then, I just have information about the spectra from 100Hz to 1500 Hz. Acoording to what I read in different articles, voice frequency can achieve values up to 6000 Hz. Shouldn’t I store the power of these frecuencies?

Thank you so much,
Helena

@helfortuny

Yes.

The basic question you need to ask is: “Will adding this feature add useful information to my analysis?”. If the answer is yes then add it, if no then remove it. The skill of a data scientist that comes with experience is understanding how to create the smallest set of features that provide the maximum amount of information relevant to the analysis being undertaken.

As an example, I had a conversation with someone who was forecasting demand for healthcare services. They were really proud that they had over 100 explanatory variables, but that it was impossible for anyone to make an accurate forecasting model – they had been trying for a year but failed. The reality is that most of those variables will just add noise and hide the signal - just like a room with 100 people having a conversation, it is really hard to hear the important conversation taking place between five key individuals. If you remove the variables not adding information and have the five key people in a room by themselves then it is much easier to understand what is happening. More does not always mean better.

Use your skill and knowledge of the subject. You know more than anyone else, if not know you will do by the time you complete the project.

DiaAzul
LinkedIn | Medium | GitHub

3 Likes

This topic was automatically closed 7 days after the last reply. New replies are no longer allowed.