Hello,
is there a way to open the Chromium Inspector in the Chromium Embedded Framework Browser?
Using right-click to activate context menu doesn’t work.
For inspecting single component, I solved by switching to the legacy Bundled Chromium Browser, but in component view the page is not rendered and I need to switch to CEF in the Menu->“JavaScript Views” options to get the visualisation rendered.
I hope someone give me an advice.
Hi @morpheusTM,
You can enable a debugging interface by adding the following lines at the end of the knime.ini file:
-Dchromium.debug=true
-Dchromium.remote_debugging_port=8888
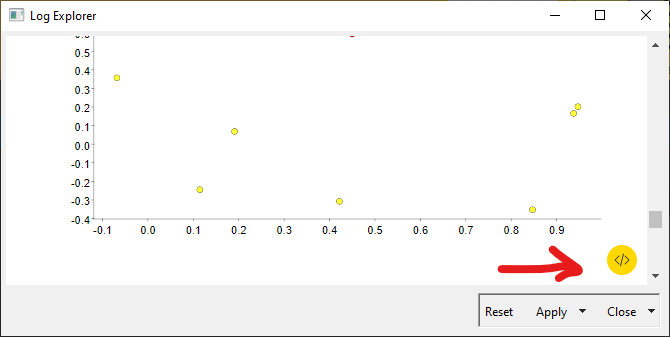
With views open you can then either open a browser window at locahlost:8888, or click the debug Icon you should find on views.
Kind regards
Marvin
1 Like
It works!
Thanks, Marvin, you made my day. 
1 Like
This topic was automatically closed 7 days after the last reply. New replies are no longer allowed.