But I encountered an issue that a child can be in different hierarchy levels and then the wf does not work properly.
If I input in the table following data in the table creator parent | child
A | K
A | L
A | M
K | R
K | S
K | T
L | U
L | V
L | W
R | X
R | Y
R | Z
B | L
B | M
B | R
B | S
B | T
The result for top parent A misses the children of the last level (X,Y,Z) because their next parent R is in top parent A relation under K, but in top parent relation B the child R is directly under B.
Would be great if anybody could find a solution for that.
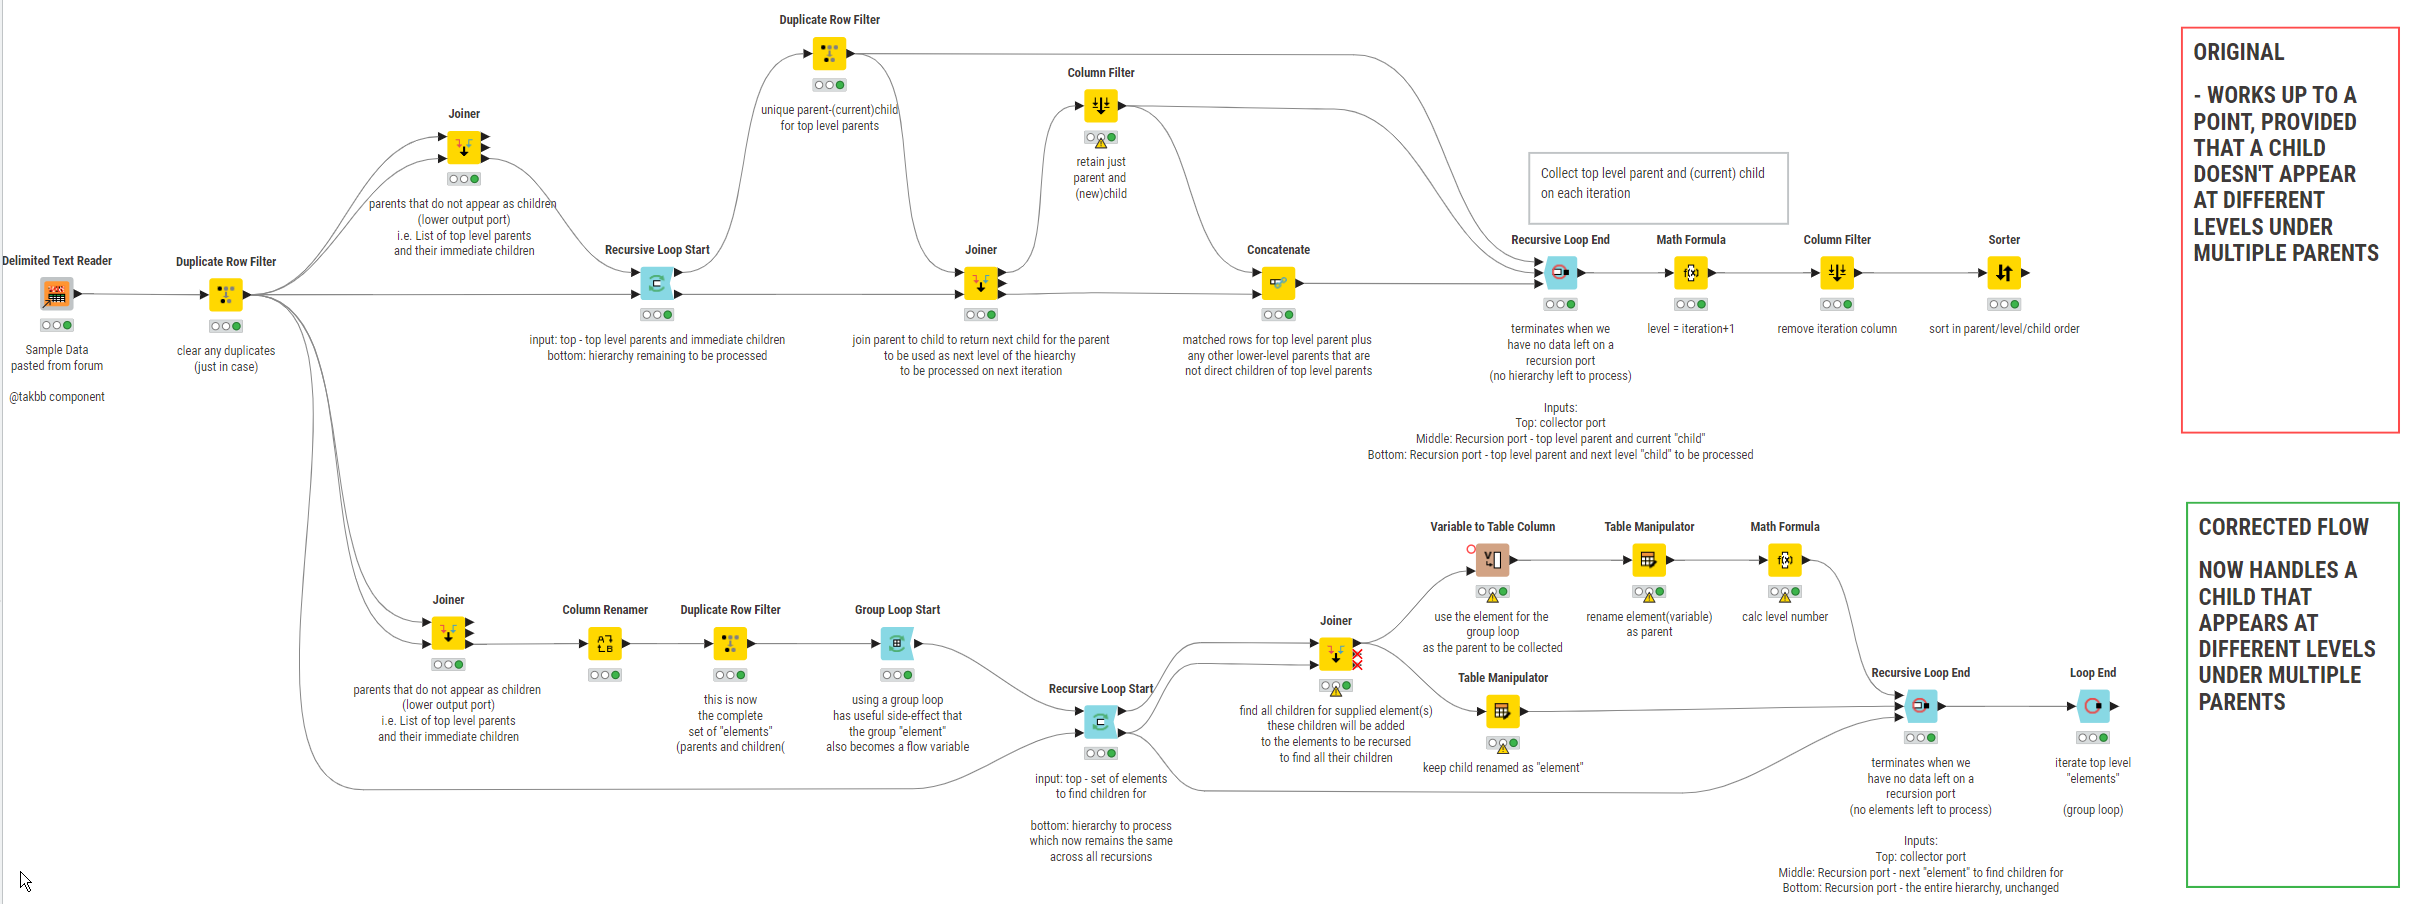
Take a look at this updated version. I’ve left the old flow in place but added a new branch below with a modified algorithm. If it works, I’ll replace the flow on the hub with this.
Using your uploaded data, the lower flow produces the three additional rows relating to “A”, so I’m hopeful that it resolves the issue.
EDIT:
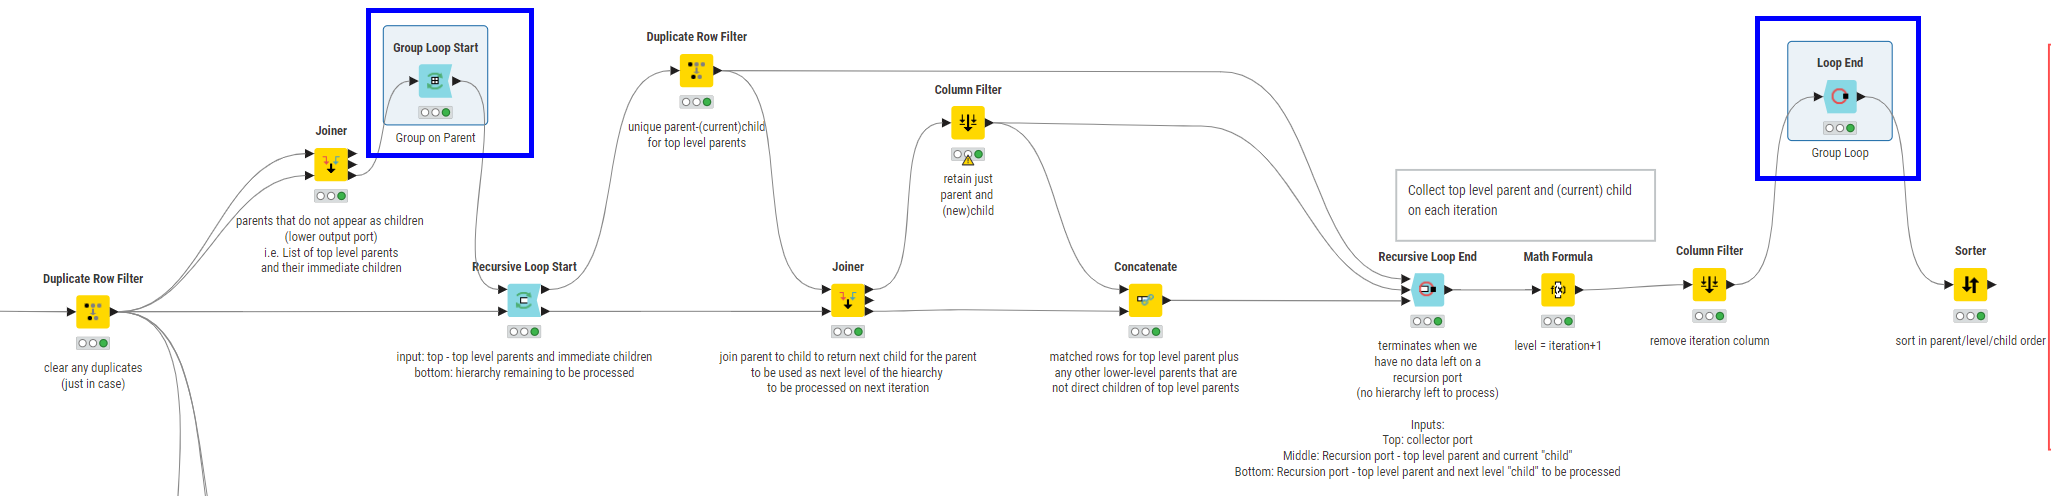
Now that I’ve reviewed the new algorithm, I realise I could probably have made the original work with the following simple modification: Introduction of the Group Loop as follows :
I just encountered another topic:
Is it possible to get for the children the quantity of how many of them are in the parent? parent | child | qty of child in parent
A | K | 2
A | L | 1
A | M | 1
K | R | 3
K | S | 2
K | T | 1
L | U | 1
L | V | 1
L | W | 1
R | X | 1
R | Y | 1
R | Z | 1
B | L | 2
B | M | 1
B | R | 1
B | S | 1
B | T | 1
E.g. K is 2 in A and R is 3 in K → 3*2=6 times R in A and respectively also 6 of X, Y and Z.
L is 1 in A but 2 in B → so this must also be considered that a child can be in different amounts in parents.
Hi @christian_kopp , can you explain a bit further what you mean in your last message. I’m looking at the data sets and cannot work out what you mean by
“K is 2 in A and R is 3 in K” or “L is 1 in A but 2 in B”.
The numbers don’t appear to me to represent the levels, nor the position, nor the number of children or grandchildren, so what do the numbers represent?
You’ve made a leap I haven’t been able to follow. Apologies if I’m misreading or missing something “obvious”
For reference, this was your (above) input data set:
parent
child
A
K
A
L
A
M
K
R
K
S
K
T
L
U
L
V
L
W
R
X
R
Y
R
Z
B
L
B
M
B
R
B
S
B
T
And this was the output data set from the revised workflow:
parent
child
level
A
K
1
A
L
1
A
M
1
A
R
2
A
S
2
A
T
2
A
U
2
A
V
2
A
W
2
A
X
3
A
Y
3
A
Z
3
B
L
1
B
M
1
B
R
1
B
S
1
B
T
1
B
U
2
B
V
2
B
W
2
B
X
2
B
Y
2
B
Z
2
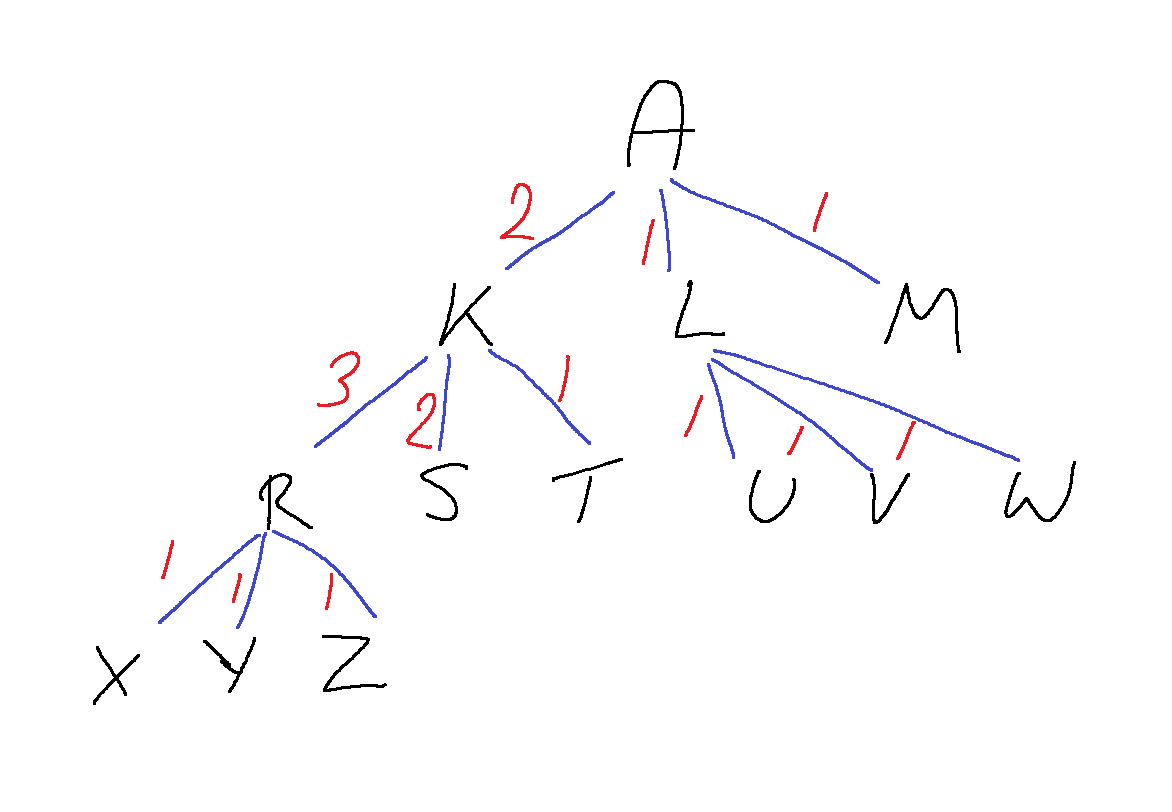
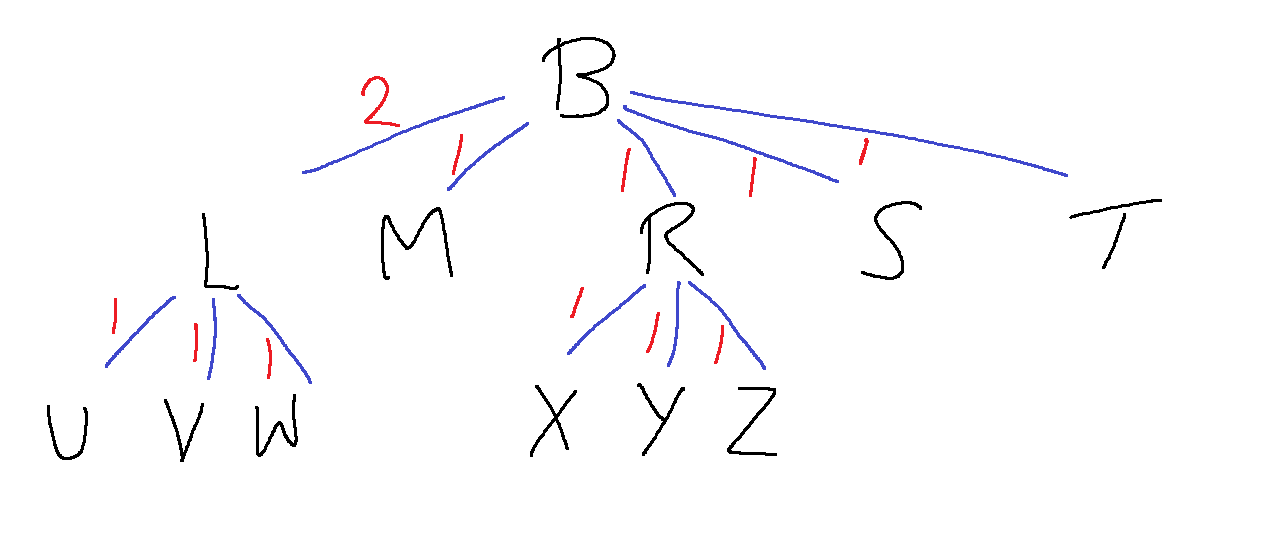
Edit. I’ve drawn what I believe is the hierarchy for A, with the numbers you’ve written for “qty of child in parent”
So what I am immediately questioning is why is the line between B and L “2”, wherease between B and R it is “1”. I can see no difference in structure between the B-L hierarchy and the B-R hieararchy.
Hello @takbb : sorry for maybe leaving out some information.
The letters represent materials built into the upper level of material and A and B represent the finished goods.
But A and B are different products which leads to the situation that they have a different material structure and can have the same semi finished materials but in different quantity.
If B-L is 2 it leads to the fact that also U/V/W is in the end 2 times built in B since L is 2 times in B.
So the new table that you gave is INPUT? I read it as being an output that needed to be derived from what had gone before. So this is a new question really then?
It sounds like you are trying to process a bill of materials (BoM) structure with quantities.
Take a look at this post.
(And see the follow up posts in that thread). I think it should be possible to adapt that for your needs. But if you can’t I’ll take a look when I am next back at the pc.