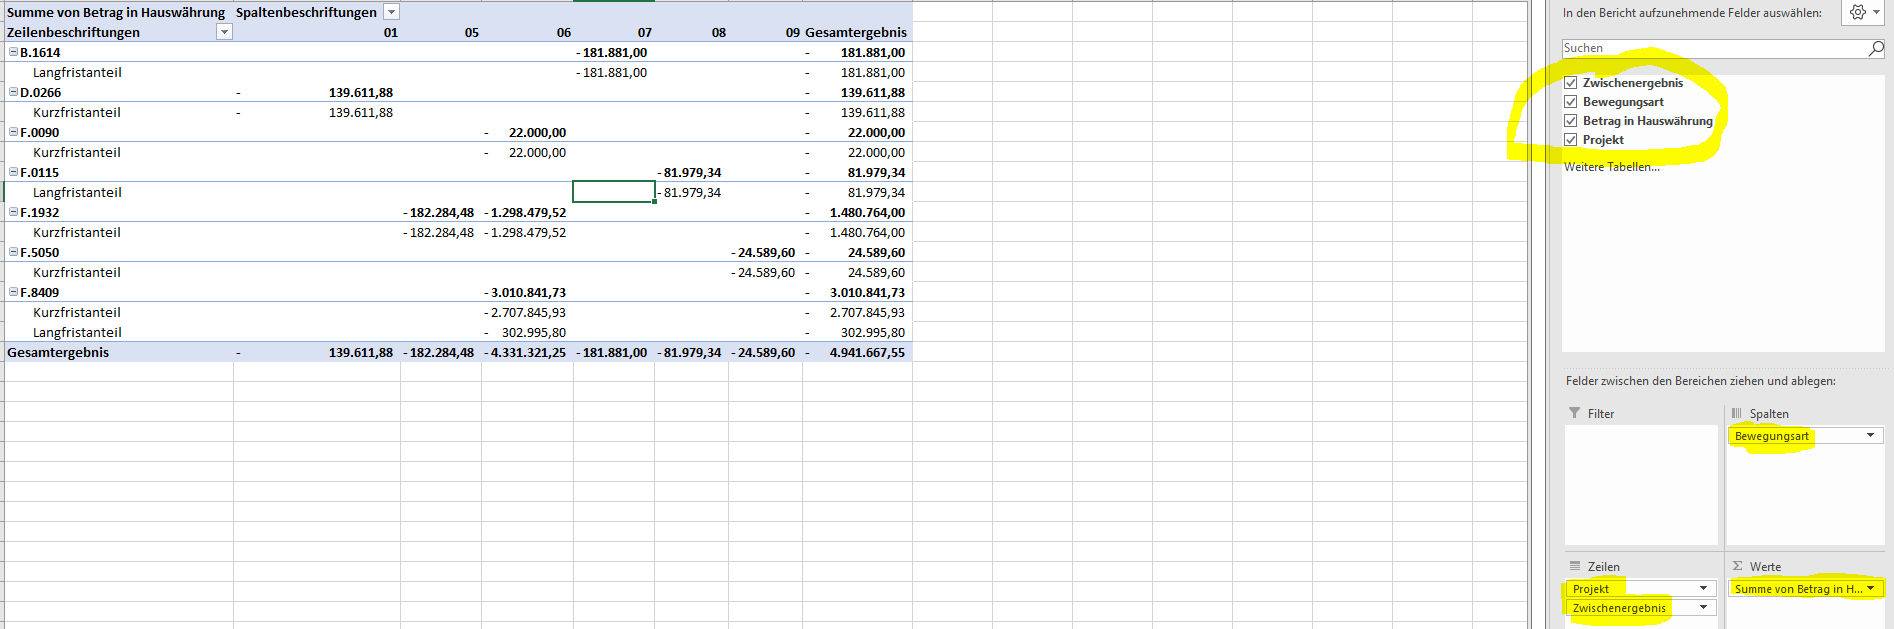
I have the attached sample data Sample_Data.xlsx (17.5 KB), and would like to create a pivot table more or less similar to excel (like in the screenshot). I tried with group by, but it did not work so far.
Again, this is a way to approach it. Could be potentially done quicker but the impact shouldn’t be that high in terms of required resources to perform this.
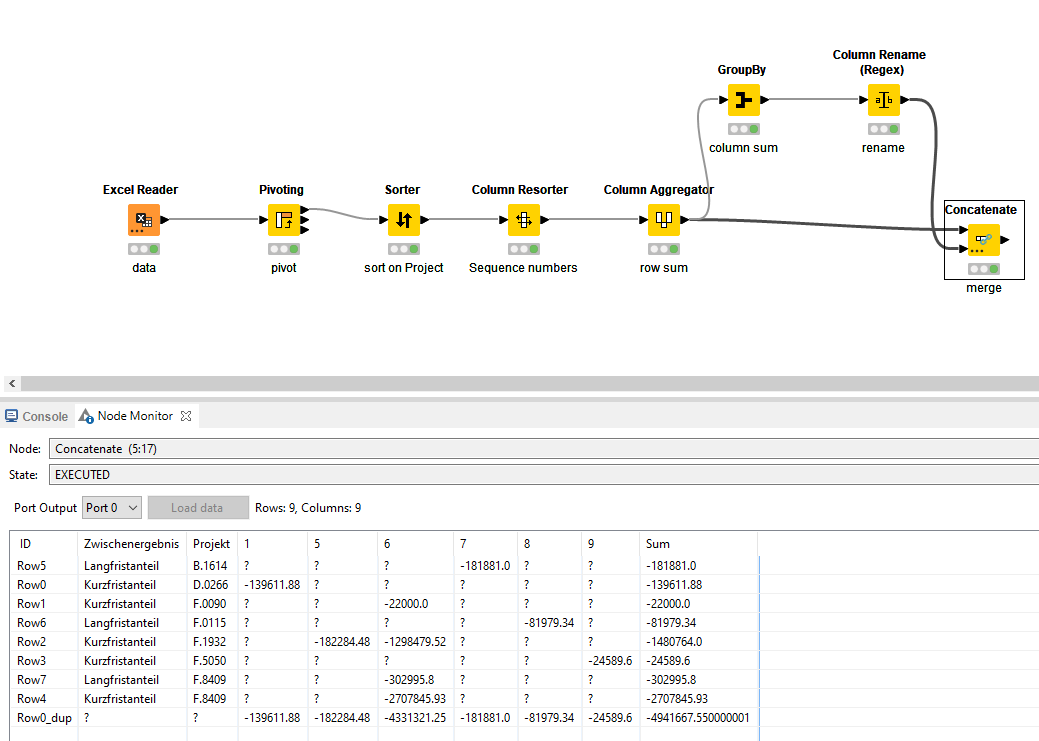
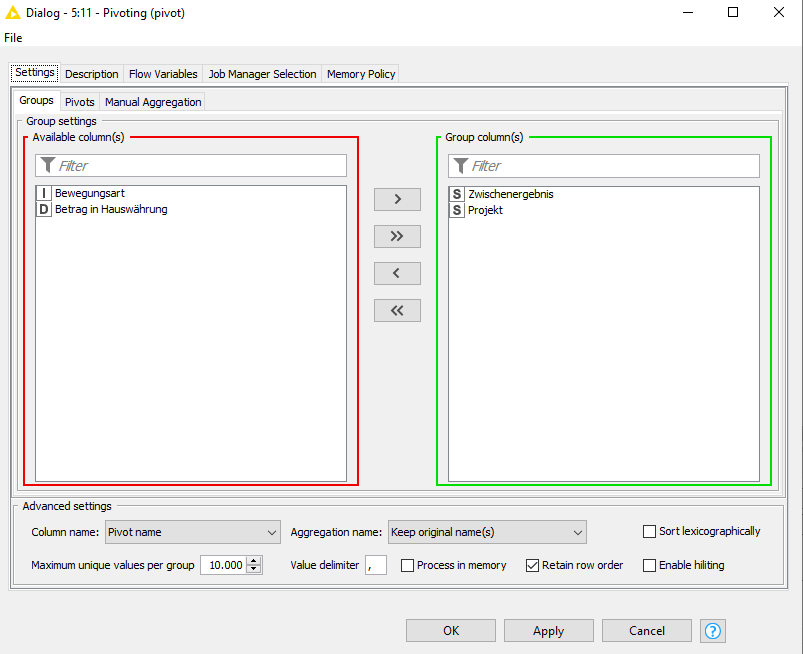
Next are some cleansing steps to sort it in the desired order, both in terms of rows and columns.
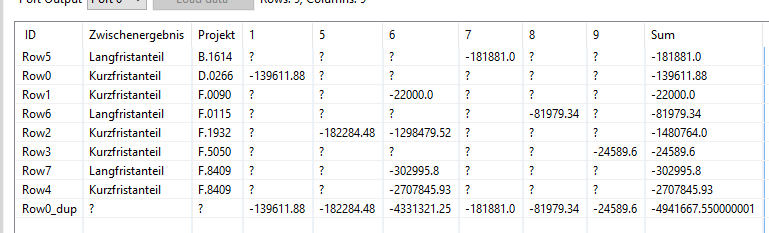
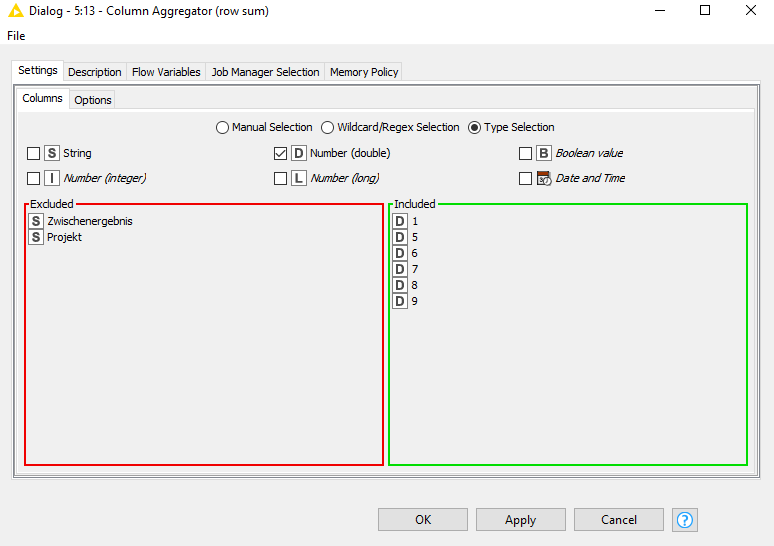
Calculating the row and column sum is next. Starting with the first, I opt for a Column Aggregator that filters on datatype Double. The aggregation method, as per the Options tabsheet, is just sum.
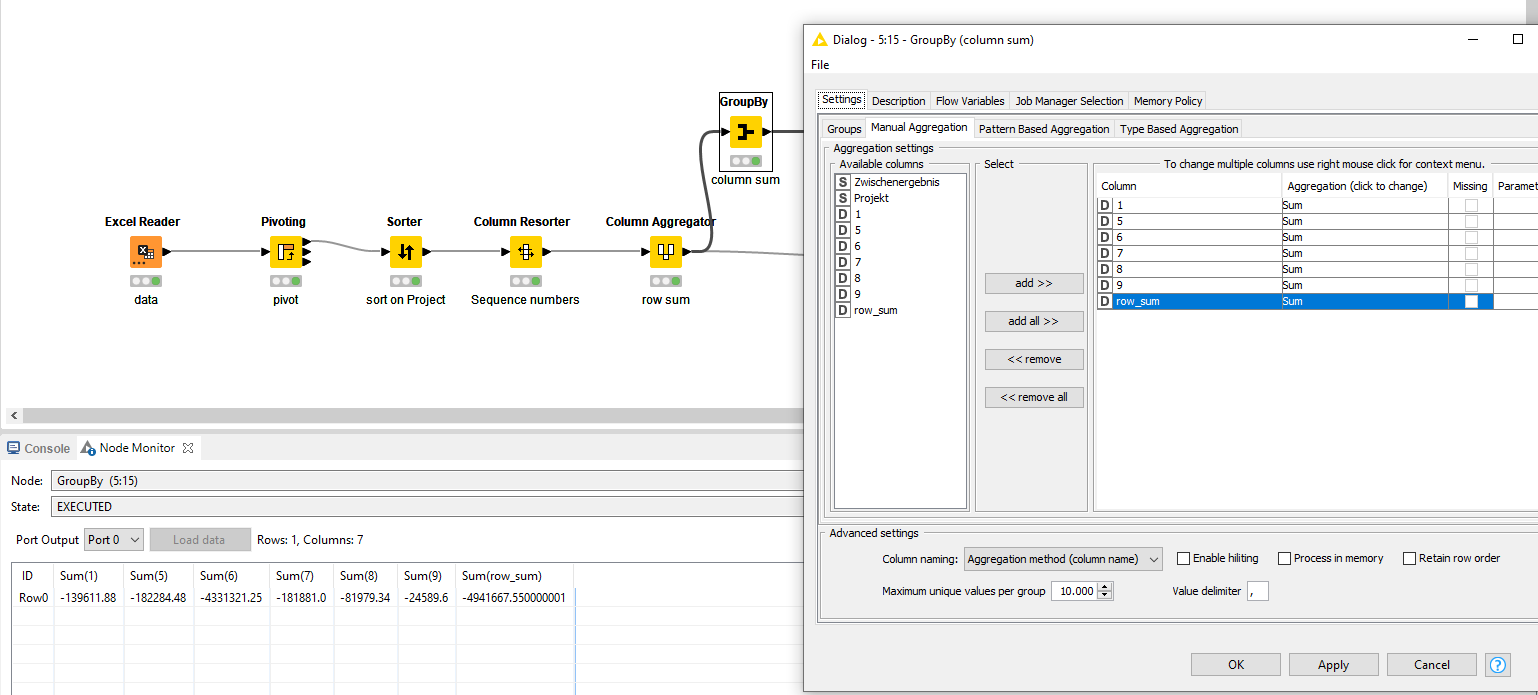
For the column sum, I opt to seperate this from the main data flow and get it via the GroupBy node. Also including the earlier calculated row_sum to get the overall sum as per your example.
To later merge this with the main table, I equalize the column names to make this easier with a Column Rename Regex node. By applying (Sum[(])([A-Za-z0-9_]+)([)]) it is converted to its original name.
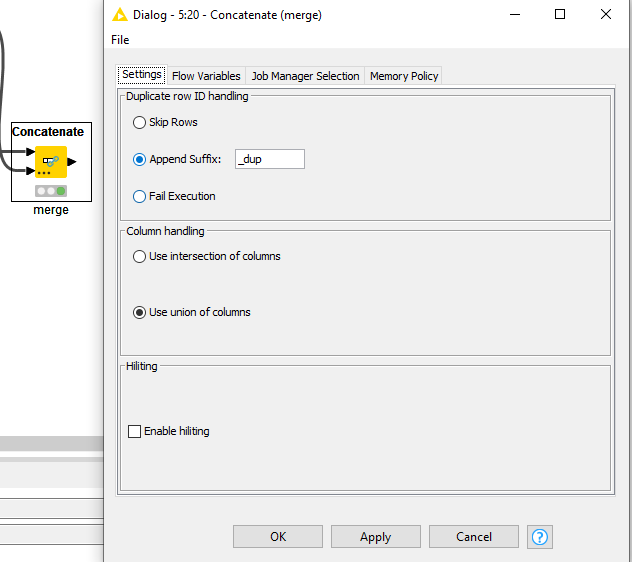
With a Union based concatenation, both are merged together and the final table is created.
Hi, @Markus3003 ,
I expect the nice workflow and detailed description of @ArjenEX to help you in getting started. I then suggest to use the row-wise and column-wise totals that the Pivoting node calculates (see its second and third output ports).
With the sub-totals you can follow @ArjenEX 's example with GroupBy and Concatenate. Here is how I would do it. pivoting_with_sums.knwf (34.1 KB)