Since yesterday I am encountering a rather strange problem when I try to create line charts or bar charts with nodes that are based on Java Script.
Whenever I try to run the Line Chart node, I get the following errors in the console:
ERROR Line Plot (JavaScript) 4:4 Initializing view failed: Executing script failed with timeout. The script is: 'return (document.readyState == 'complete');'
ERROR Line Plot (JavaScript) 4:4 Retrieving image from view failed: Executing script failed with timeout. The script is: 'return document.getElementById('node-SINGLE').contentWindow.knimeLinePlot.getSVG();'
This then leads to the node not generating any grahic results.
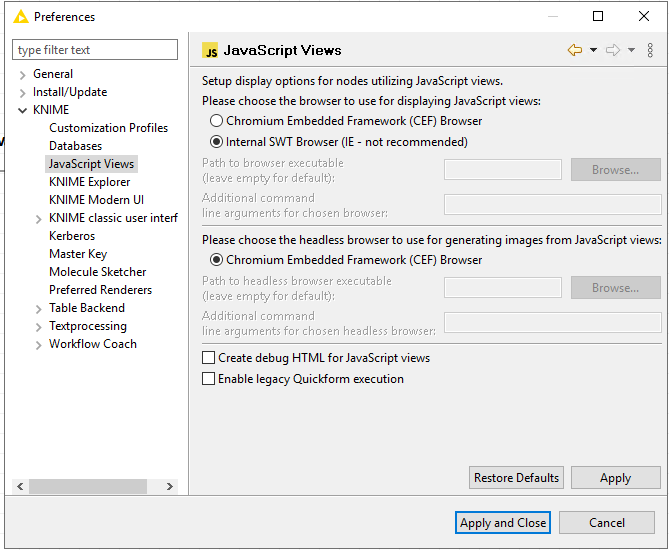
this sounds like the view is rendering too long and is therefore running into a timeout. Can you disable the image generation and report on how long it takes to open the view? Is it possible for you to share the workflow?
when disabling the image generation I get a result instantly. I expect the issue not to be related to the input data as I have generated an example workflow for the upload here and the error remains the same. Maybe you can spot some other issue with the used nodes.
With your workflow, I’m able to reproduce the error. Thanks for sharing. However, I had to set KNIME to use a rather small amount of memory/RAM to run into the error. Therefore, a quick workaround on your end may be to increase the total memory that KNIME is allowed to use.
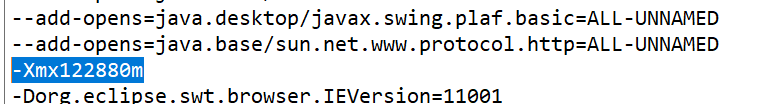
This is configured in the knime.ini file that lives in KNIME’s installation folder (e.g. C:\Program Files\knime\knime.ini). The parameter that determines the memory is called “-Xmx”. For instance, you could set it to -Xmx8G to allow KNIME to use 8 GB of memory. I recommend setting this value up to about 50-65% of your total memory.
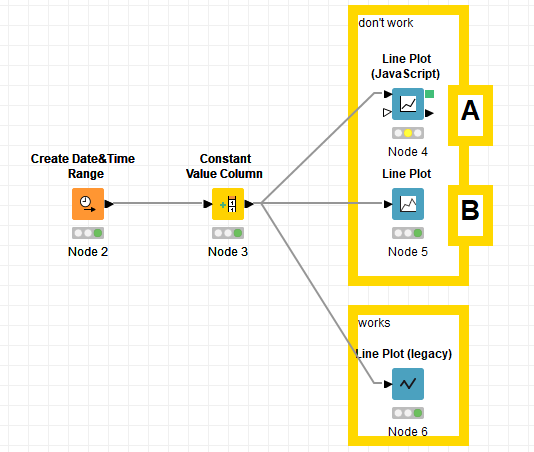
I continued to look into the issue with the plots that are not working and discovered a rather strange interaction between two nodes:
The workflow that I posted contains two nodes that are not working. Lets call them A and B.
So if I open Knime and start to execute the whole workflow, I get the errors as shown in the posts above. And no results in A and B.
If I then close Knime, reopen it and execute B separately before A, It suddenly works. Which means that I get a proper line plot for B and after that I can execute A and I get a proper result there as well.
It is even more interesting as this extends to all the other workflows that I open and execute after that as long as I don’t close Knime. Once I do that, I need to execute B separately again in order for all the other line plots to work.
thank you very much, this helped a lot.
There was an issue in the browser initialisation in 5.1 which caused this problem. This is also the reason why experience the problem only if you execute A before B, as B would initialise this browser correctly and it would work afterwards. The issue is already fixed in the nightly and there is a 5.1.1 release planned for the coming weeks.
Thanks for reporting and sorry for the inconvinience.