So I have created a process map using R for a sample dataset. I have also placed the code in the R View node. Currently, the map gets outputted locally on my computer but I would like to connect the image output directly into another KNIME node. For example, the image output widget. I am confused as to how exactly can I get the map to go into the image output of the R-View node. Since process maps are not graphs, I can’t use the plot command in R . It would be great if someone can help me out. Thanks!
Hi,
Thank you for your help! I tried the workflow posted but is there a way of directly outputting an image rather than a plot from the R-View node. Because, the R code output that I have is a process map which is an image and does not have x,y, or title so I can’t use qplot, or plot commands in general as that give me an error in KNIME.
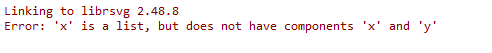
The issue I am facing is how can I get this graphic as an actual image output so it can be passed into the next node in KNIME. Right now, I have a render_graph command in my script which renders this graph somewhere on my computer. I can’t seem to access the location. I tried other commands in R such as export_graph but that doesn’t seem to work. If I try plotting it, I get the following error since the map is not a plot
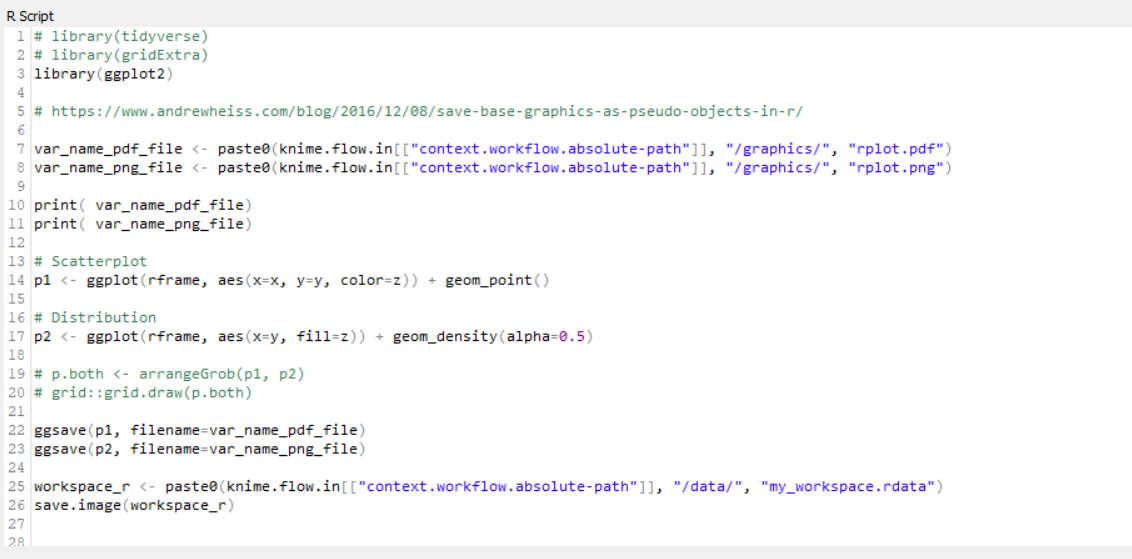
which you can find in the solution posted by @mlauber71 at the following link:
I tried it and the only thing i needed to change (because I’m working on Windows) is the way the folder separator is coded (from // to \). The fully run version compatible with windows is available from the following link: