I am running python script for t-sne dimension reduction, All is working ok inside python script but when I run python workflow it get stuck at 30% and not passing to KNIME workflow.
Please see my script below.
Can anyone suggest how to make workflow working?. Thanks for your help
output_table = input_table.copy()
from sklearn.manifold import TSNE
import numpy as np
import pandas as pd
import seaborn as sn
import matplotlib.pyplot as plt
from time import time
from sklearn.decomposition import PCA
df1=input_table.copy()
data = df1.iloc[:, 1:].values
label = df1.iloc[:, -1].values
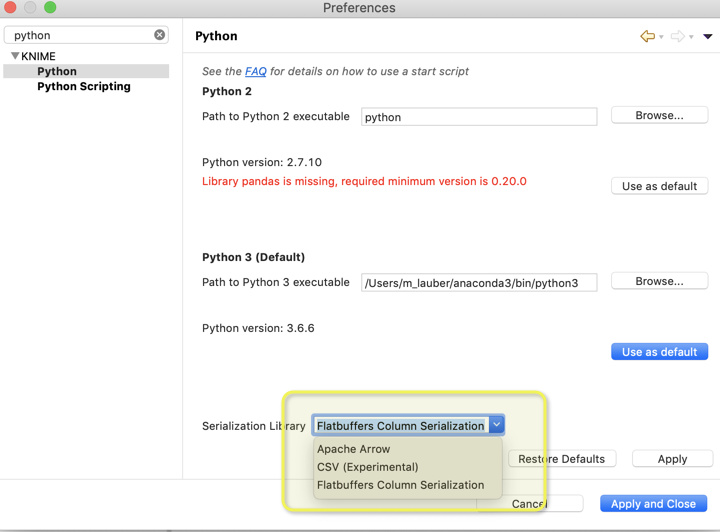
the node is busy transferring your data from KNIME to Python.
The reason it works in the dialog is because the dialog only uses a subset of the table (you can specify the subset size in the second tab of the dialog).
In order to reduce the transfer time, make sure that your table contains only those columns that are actually used in the Python script.
You can use a Column Filter prior to the node to remove any unused columns and rejoin them with the Joiner node after the Python script.
Hi Nemad,
Thanks for your reply. Really appreciate your help. I have nearly 3000 columns (features) and 1 label. I can not use column filter to reduce features and I think I am only using the features I need. When I cut to only 5 features(columns) and a label then it works.
Can you suggest how to use all columns(features)? .
Thanks, Suresh
Last resort could be to draw a sample of your data although I am aware that the beauty of t-SNE is the specific ability to reduce the dimensions on very large numbers of instances.
from sklearn.manifold import TSNE
import numpy as np
import pandas as pd
import seaborn as sn
import matplotlib.pyplot as plt
from time import time
from sklearn.decomposition import PCA
data = input_table.iloc[:, 1:].values
label = input_table.iloc[:, -1].values
The main problem might be the large number of columns that are transferred to python.
You could reduce this number to two columns by forming a collection column that contains all features (Create Collection Column node).
Please note that I am not sure if this admittedly hacky workaround does actually provide any performance gain but it might be worth a try
Python script work but not sure how to give colors of my binary class so that I can see 2 classes when plotted in 2D.
Any code that help me to implement in python script?
Thanks