Hello all,
I will be grateful, if somebody can help me with forecasting flow.
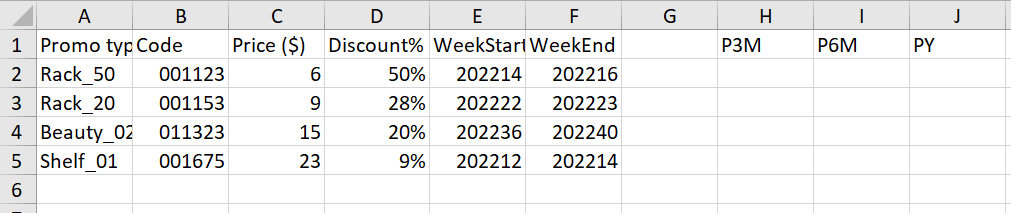
I have to make a forecast in 3 columns as on pic.B. First is P3M (Forecast made with data of past 3 month), second P6M (Forecast made with data of past 6 month), and third PY just for Promo types Rack_50 and Rack_20 - Past year (So forecast from data of the same period of last year).
For the P3M: If in POS data of past 3 month there was promo with the same promotion type, code and price (if in these period there is no the same price it can be data from the same discount %) during past 3 month, it should find avg for 1 day and calculate it to the count of forecasting days.
For the P6M same but data but past 6 month.
For PY: If it is Rack_50 and Rack_20, and there is a data from the same period of last year? with the same price, code and promo type, should find avg for 1 day and calculate it to the count of forecasting days.
Who knows how I can do this kind of work flow on KNIME?
Please help me, if u know how to do it…
Hi @Nury , first of all, you should share your data so we can have something to work with. We can’t copy the data from a screenshot, meaning we have to enter these manually, and I don’t think anyone wants to do this.
Secondly, you should show what the expected results should be. Your Pic B shows what table structure you want the results to be, which is good, but you could have included what values for these 5 columns should be in each of the 3 columns, that way it gives us a way to validate that we have indeed understood what you said.
Additionally, while providing the values for the 3 columns, you can explain how you got them so we can figure out the formula to use - or even better if you have a formula.
Result should be forecast In P3M, P6M and PY columns.
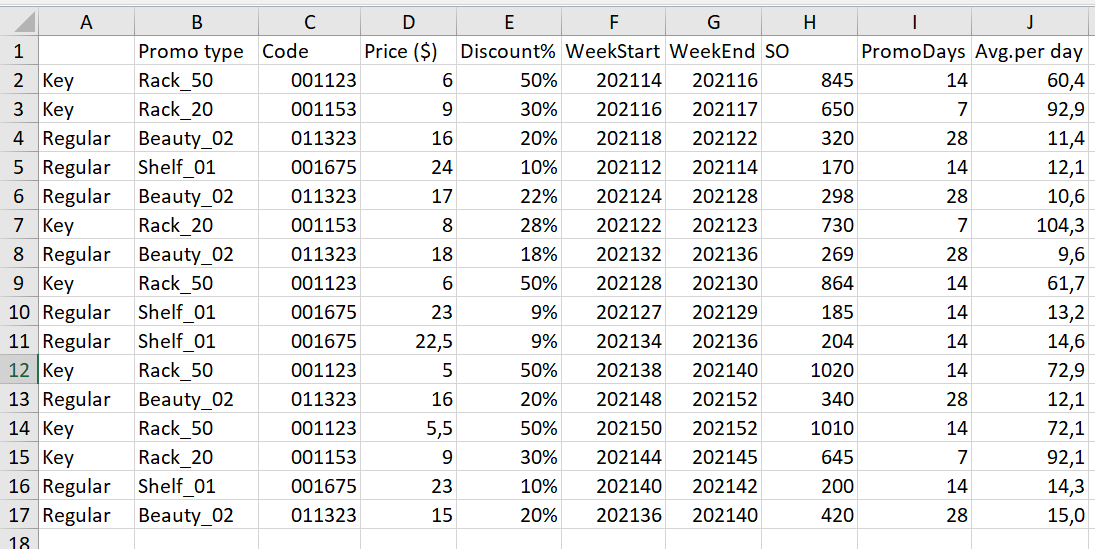
pic.A is a POS data (with data which product, under which promotion type when, what price was sold).
So on pic.A Column H = SO (Sold out) how many was sold during this promo period.
Column I = PromoDays (how many days we had this promotion) Formula: weekend-weekstart * 7
Column J = Avg.per day Formula: SO / PromoDays so I can see how many products were sold in avg every day.
For P3M:
Finds the same promo in the history of the last 3 months (There is columns Weekstart and weekend which is included year&weeknum), if the promo type and Code matches and the same price: avg.day data (pic.a) * Promo days (pic.b).
Thus, the result of this column will be the forecast obtained using the data for the last 3 months. If there is no the same price in last 3 month then it should find closest price to predicted one (pic.b). If there is no the same promo type and code in last 3 month it is should be empty.
P6M
Same as P3M, But taking results from last 6 month.
PY (Just for key promo for regular its empty)
Finds the same promo with the same weekstart and weekend of the last year: avg.day data (pic.a) * Promo days (pic.b). If there wasn’t the same promo last year on the same period, and if there is different price (price (pic.A) and price (pic.B)) = empty.