Hi all,
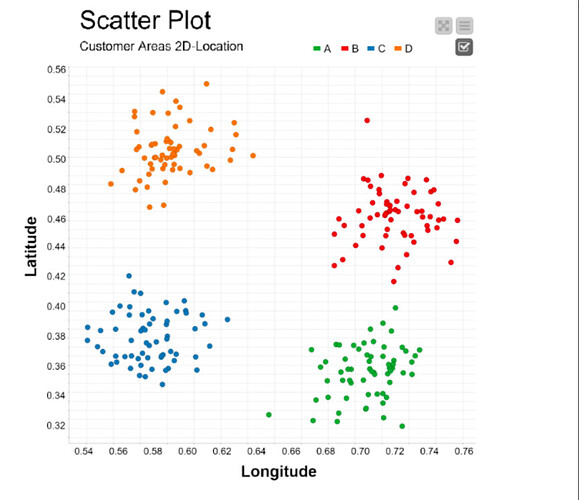
Can anybody help me with the configuration window for the below scatter plot, or workflow if applicable (the prtscr is from the Knime Community - “Data visualization 101”).
Trying to construct a multi-series scatter plot and I cannot find any guidance on this.
Thanks
