Hello!
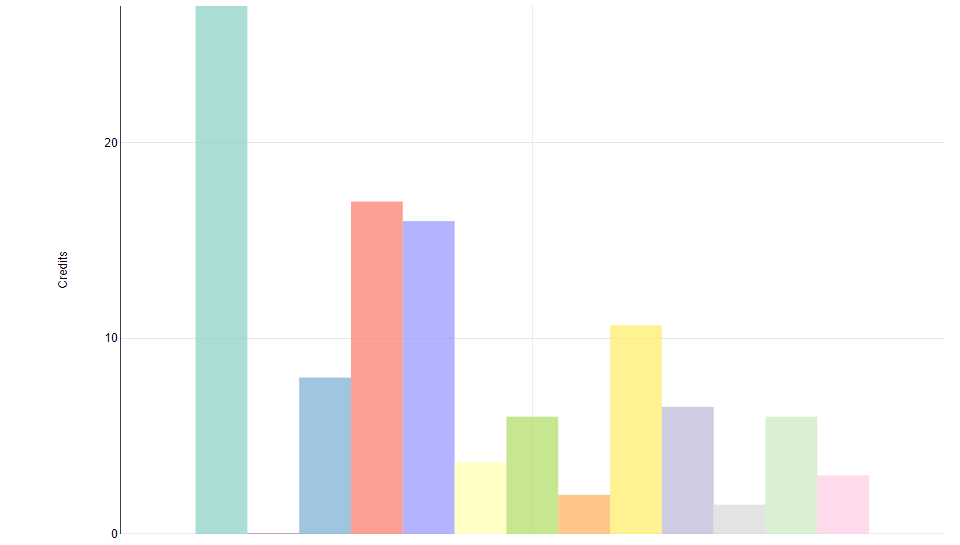
I’m hoping someone can help me with bar charts. I’m trying to figure out how to set the max value on the y-axis. For example, this bar chart has a max value of 27 so I want the y-axis to be set at 30.
I’m trying to make multiple bar charts for comparisons between schools so I would like the y-axis to be consistent across all of my different bar charts. Thanks!
Hi @ciarroccacm
I was hoping this could be done with the custom css attribute knime-axis-max-min
for the Barchart but I can’t get the proper syntax working.
Maybe someone from the KNIME team can provide further clarification on this.
There is a great alternative available however made by @AlexanderFillbrunn. See below:
It allows you to set the desired Y-axis value which is reflected accordingly:
Hope this helps!
2 Likes