Solutions to "Just KNIME It!" Challenge 09 - Season 2

I give this a try by (ab)using two learners and scoring them in r^2 adjusted. looping this per column

credits go to @paolotamag for the r^2 adjusted part

3 Likes

Me? Where did you find that metanode if it’s mine? Can’t remember :sweat_smile:

3 Likes

i downloaded this

2 Likes

Hi dear KNIME users,

As a french KNIME user I couldn’t miss the challenge this week ! :wine_glass:

I have tried several options, with AutoML and other components, but it was too close of what has already been proposed here so I wanted to change the possible points of view on this problem and bring something more to the discussions. Feel free to answer, discuss or add comments or remarks to any of these points :

  1. I have considered this was a classification problem, instead of a regression one (since it involves rating, so numerical ordinal target), but both options seem acceptable (will perhaps try the regression case just for fun and see how it differs from the classification one).

  2. When dealing with Machine Learning algorithms, I often see workflows where overfitting (because of improper data split) or data leakage (because of exploratory data analysis done on the whole dataset, or any preprocessing steps done on the whole dataset) occur.
    I wanted to propose a workflow that should assess fairly the performances of a classification algorithm : Train and Test set are separated just at the beginning, and steps done on the training of the model are only done with the train set. The Exploratory Data Analysis is done only on the training set. Since I used a tree-based method and since the dataset is pretty clean, there are no need for transforming the variable or advanced preprocessing steps for outliers analysis or missing values imputation. If it was needed, it would have been fit on the training set, then apply on the test set, to avoid data/information leakage. As I’m using Random Forest, the bootstrapping process already enable an implicit validation and prevent overfitting with Out-Of-Bag samples. I also tried XGBoost and other boosted algorithms, but performances were lower ; it seems normal as the data can be quite noisy if the ratings come from human labelling.

  3. Since I am dealing with a classification problem and the classes are not well balanced, there are two versions possible in my workflow :

  • One with 4 rating classes (4, 5, 6 and 7): class 7 and 8 are combined, as well as 3 and 4 to have sufficient sample size and avoid having too much “dispersion”.
  • One with 3 rating classes (Low, Medium, High): class 7 and 8 are combined as “High”, 3 and 4 as “Low” and 5 and 6 as “Medium”.

What I wanted to highlight with the comparison of the two class possibilities here is the fact that the more class there are to predict, the more difficult it is for an algorithm to find the classification rules (in general). Here, looking at the comparative results from the two scorers, we can see less classification errors in the case of 3 classes compared to 4 classes.

My solution is less oriented towards algorithms optimization, but more on the understanding of the use case and possible different interpretations on how to deal with the data. Other domain experts, users, data scientists/analysts may have different views on this, and the difference in results is often more a question of how people deal with the inputs, rather than the algorithm (and optimization) chosen.

Here is how the workflow looks like (quite simple) :

And here is the link to have a view or download it : justknimeit-S2-09_Victor – KNIME Community Hub

Sorry for the lenght of this post, I hope this will bring new ideas and discussions ! :slight_smile:

10 Likes

Hi all,
Here is my solution.

The higher the alcohol and the lower the volatile acidity, the higher the quality of the wine tends to be.

4 Likes

Hi everyone,
here is my solution.

3 Likes

My take on the challenge 9 . I have used the feature selection forward and then global feature importance for interpretation and selection …


Anil

2 Likes

Hi!
This is my solution, similar to others.
I did a linear correlation/regression and a random forest regression and i compare them.

1 Like

Hello everyone, this is my solution.
I referenced to Knime’s solution and found that it is more reasonable to transform the quality label into a binary label. The reason is that if it is a segmented label, the distribution of labels is unbalanced; If it is a binary label, there is no such issue. thank you.

4 Likes

Hi all - back from a small hiatus. Here is my solution. I went with a linear correlation node to determine which attributes had the most impact on quality and my custom plotly correlation matrix view for dataviz and a plotly bar graph for displaying rank-order of attribute correlation.


3 Likes

Hello JKIers
This is my take to the JKI S02 CH09.

My result differs from previous posts; but please don’t take it as an starting argue, as I’m not really an expert working with ML algorithms. This result is more related to the data pre-processing I did.

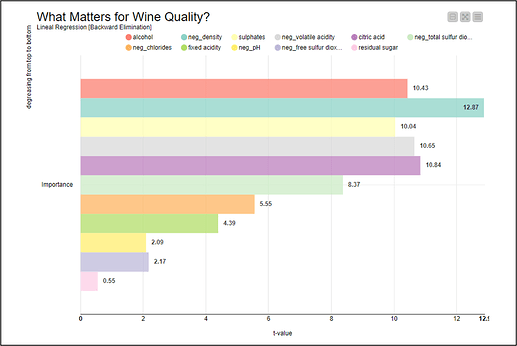
This is something already discussed in JKI S2 Challenge 5 when confronting quality vs pollution… they have negative correlation coefficient because of opposite meaning; but it doesn’t mean that coefficient of determination has to be negligible.

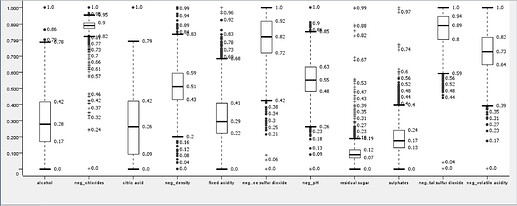
Then I pre-processed all independent variables turning into negation form (this is: 1 - normalized value [0 to 1]), all those independent variables that presented negative Pearson’s vs dependent variable. Renaming them with the prefix ‘neg’.

In my result negation of density (lightness?) has become the second independent variable in importance to define quality. That in terms of wine quality makes some sense :thinking:

All along with what I’ve already exposed; I’m not considering the challenge 09 as a predicting exercise. I’ve interpreted ‘Importance’ as a ranking of all independent variables in terms of significance degree related to a multiple lineal regression model. So I ran a multiple linear regression backward elimination, without significance level restriction.

Happy KNIMEing
8 Likes

Hello everyone,
Here is my solution.

As other participants have already done, I classified “quality” into two or three categories. I compared the feature importance using a simple random forest. “Alcohol”, “sulphates” and “volatile acidity” appear to have relatively high scores in both models. Are “sulphates” a type of additive or preservative? If so, I guess they would have some influence on the overall quality.


6 Likes

Hello everyone, here is my solution.

As many other participants I recoded the labels to category, so I have been solving the classification problem. And as @Victor_G mentioned, the data set is extremely unbalanced, so I also worked with 2 cases (thank you for this idea): the original set of classes and reduced with 3 classes: low, medium, high.

First I did correlation analysis which makes sense, since even in the feature names one can see that they are very close to each other - they are different types of the same measurements (acidities, sulfur dioxide measures). So I created a component that allows users to apply correlation analysis or go without it.

To start with feature analysis I tried with a straightforward counting the number of the splits candidates for Random Forest, which is in general a good approach. Then I found this wonderful component in this thread - “Global Feature Importance” which also does split analysis and much much more. Anyway it seems that for all cases - with/without feature correlation filtering, original set of labels / reduced set of labels, the selection of the desired class - the main set of features are pretty much the same: alcohol, volatile acidity and suphates.

I also applied conformal prediction, however I could not apply it for feature importance analysis (at least for now), but it gave me a good overview regarding how hard it is to make the predictions, since for the original labels I always got the prediction sets with at least 2 classes. The situation got better for the reduced labels set problem, and it is possible to see the examples of “golden” representatives for each class. Still comparing validity vs efficiency showed up quite bad results for the problem with original classes.


And the situation slightly improved for reduced number of classes for the biggest (“low”) class.

3 Likes

hi, KNIMEr, :partying_face: :partying_face: :partying_face:

Here is mine.

This is just a benchmark work.

Honestly, I find this question quite challenging due to two main factors. Firstly, there is an imbalance in the data which makes it difficult to improve accuracy. Secondly, interpreting feature importance is also a challenge, even though the task only requires us to display feature importance in order.

I believe this is a regression problem rather than a classification problem. While the quality scores in the dataset are integers, they have different sizes. If we use regression and the true quality of the wine is 6, a prediction of 5 would not be too far off. However, if we approach it as a classification problem, both a prediction of 5 and a prediction of 2 would be considered incorrect. Although they may not seem vastly different, they actually have significant distinctions.

workflow

I generated a string variable called ‘quality_str’ and used it for sampling. Then, I inputted it into the “H2O Random Forest Learner (Regression)” to obtain the result.

The visualization of the prediction data at the end is noteworthy. The horizontal axis represents the actual values, while the vertical axis represents the predicted values. Notably, the predicted result is slightly skewed towards 6 when the actual value is 5, as shown in the green box. Similarly, the value that is actually 7 is also biased towards 6, as shown in the red box. A potential solution to this issue could be an increase in features, but no such attempt was made.

Regarding the interpretability of machine learning, there isn’t much time to address this challenge this week. It’s a pity.

Best,
HaveF

3 Likes

:nerd_face: Exceptionally a little earlier this week, here’s our solution to the latest Just KNIME It! challenge! :nerd_face:

With our methodology, alcohol content seemed to be the most important feature in determining the quality of wine :wine_glass: We are again very impressed :exploding_head: with the variety and depth of your solutions, and can’t wait to see what you will prepare for our next challenge!

6 Likes

Hi, crazy KNIMErs, How are you doing?
Do you already have a tan to go to the beach? :beach_umbrella:

My solution goes the same way as other colleagues: JKISeason2-9 Ángel Molina – KNIME Community Hub
To add some added value, I tried to make another solution with “Shapley Values”, but the node “Global Feature Importance – KNIME Community Hub” is perfect for this solution, I think.
2-9

See you on the next #JustKnimeIt :mechanical_arm:
PS: If you want to see other projects, you can see my Twitter and LinkedIn.

4 Likes

Hi Everyone :slight_smile:

I’m a bit late, but here is my solution to challenge 9:

I have taken the simple approach of using the -Decision Tree Learner- and -Decision Tree Predictor- nodes and treating the challenge as a classification problem.

I have used the -Decision Tree to Ruleset- node to extract the rules and then used a Group Loop to loop through each predicted quality value (4-7) and count the number of times a feature is present in the quality rule set.

This led me to being able to present the results as a -Parallel Coordinates Plot-

As in the solution presented by Aline, the most important feature is the Alcohol content followed by Sulphates. It is apparent that only the first 3/4 features have any importance in determining the Quality of the wine and the other features can be ignored.

You can find my solution on the hub here:

Best wishes
Heather

5 Likes

Hello Everyone!

I published some late the challenge, but for this one, I had never worked before with a similar problem, and I needed first to know why was important the data for wine quality.

I appreciate so much the information @MoLa_Data share with me, to understand the requirements for the present challenge, and I based my approach on the solutions published by @MoLa_Data & @alinebessa .

The first was needed clean and adjust the quality features between 4 and 7, this step was made using the Numeric Outliers components.

The next step working on the mean and the standard deviation on the differences between the prediction from the AutoML and the prediction from the node performing Target Shuffling by randomly permuting.

Here are some images from the workflow:


JKISeason2-9 – KNIME Community Hub

1 Like

Thanks @elimisael for your mention.

Your solution a amazing :+1:

This topic was automatically closed 90 days after the last reply. New replies are no longer allowed.