This week, our tenth challenge of this season focuses on Restaurant Yummy and how well it is doing in terms of sales . It’s an ETL problem and we’re excited to see your creative solutions to it!
Here is the challenge. Let’s use this thread to post our solutions to it, which should be uploaded to your public KNIME Hub spaces with tag JKISeason2-10.
Need help with tags? To add tag JKISeason2-10 to your workflow, go to the description panel on the right in KNIME Analytics Platform, click the pencil to edit it, and you will see the option for adding tags right there. Let us know if you have any problems!
Hi @alinebessa thanks for sharing the challenge I just had a look at the data and wanted to check that its correct that it only contains 1 and a half months of the year?
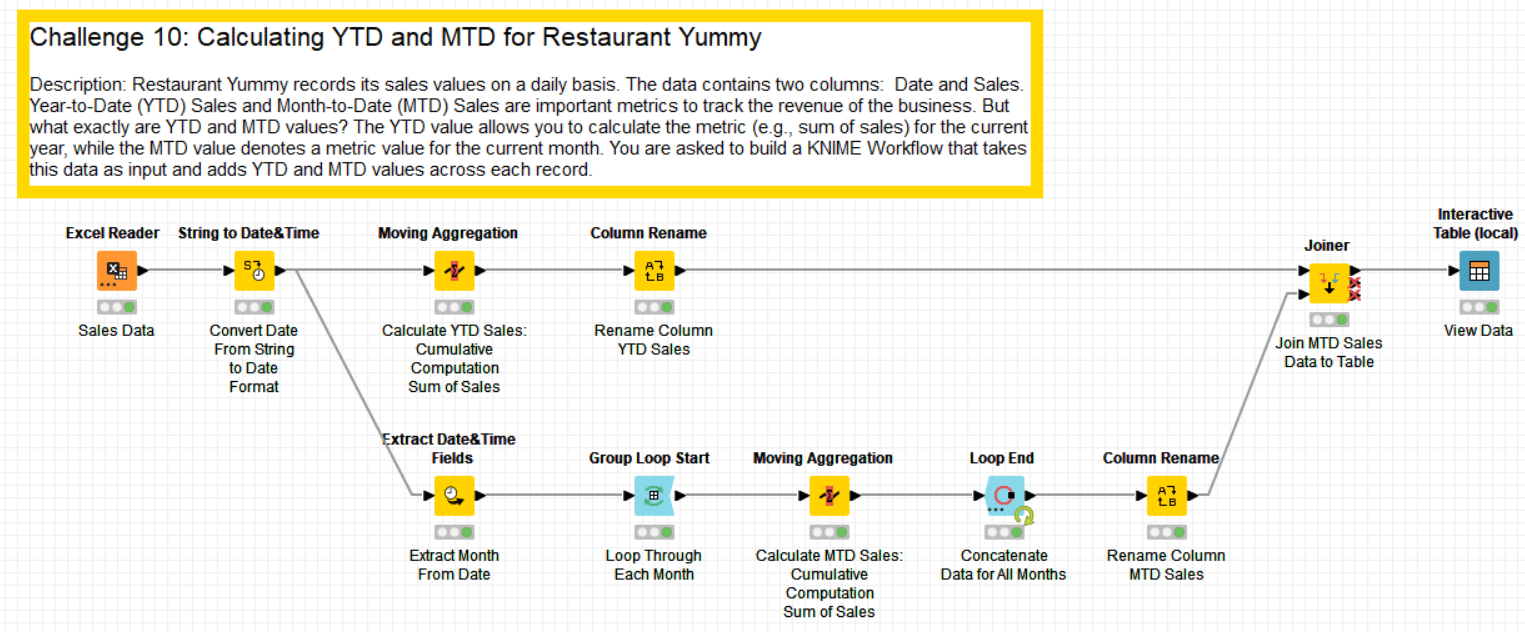
My solution this week converts the Date column from String to Date format and uses the -Moving Aggregation- node to calculate the Cumulative Sum for the YTD Sales. For the MTD sales, I have performed the same moving aggregation but this time after having extracted the month, I have cycled through each month using a -Group Loop-:
As the author of this Challenge, I am delighted to witness a plethora of submissions on the very first day. I extend my heartfelt appreciation for the correctness and quality displayed in all of the solutions. Well done!
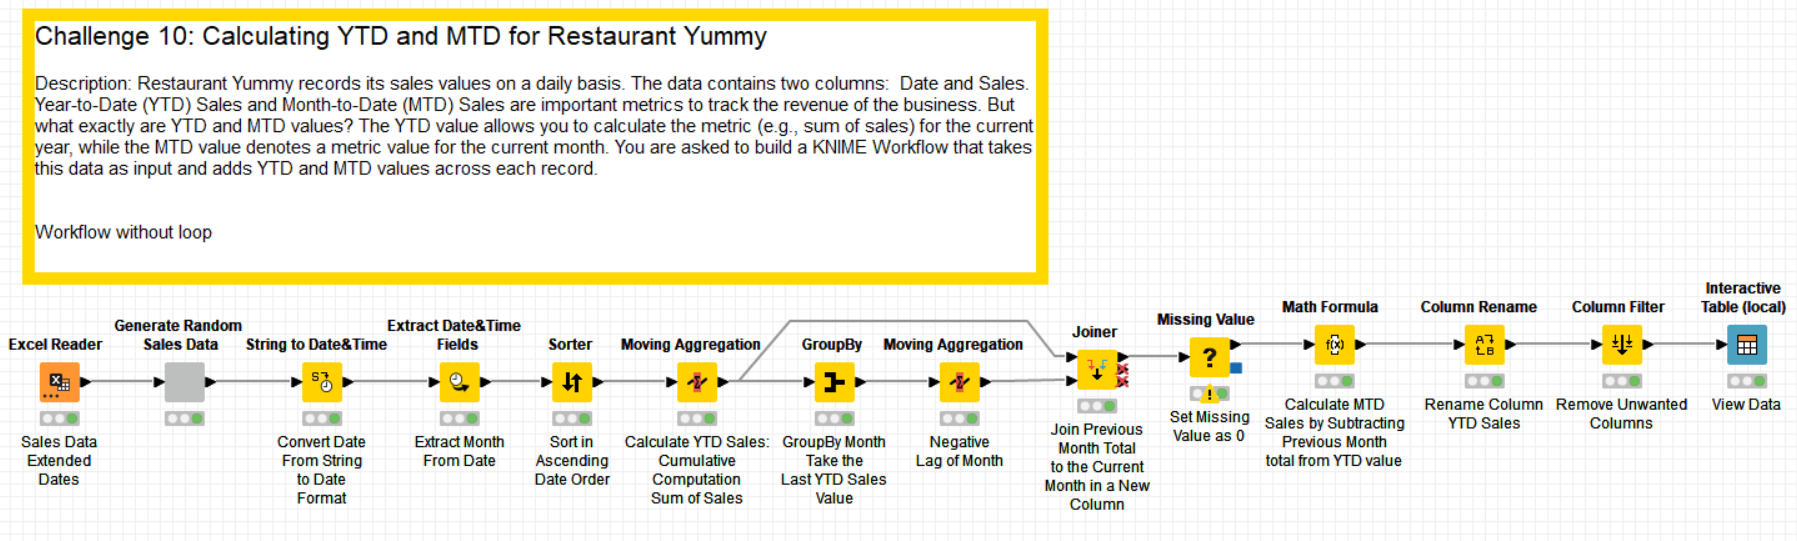
In order to stimulate your intellectual prowess even further (if I may indulge), I have managed to solve this Challenge without the use of loop nodes. I kindly invite you all to explore the possibility of solving it through alternative means, avoiding the usage of loop nodes.
I’ve attempted your challenge and I think I’ve done it!
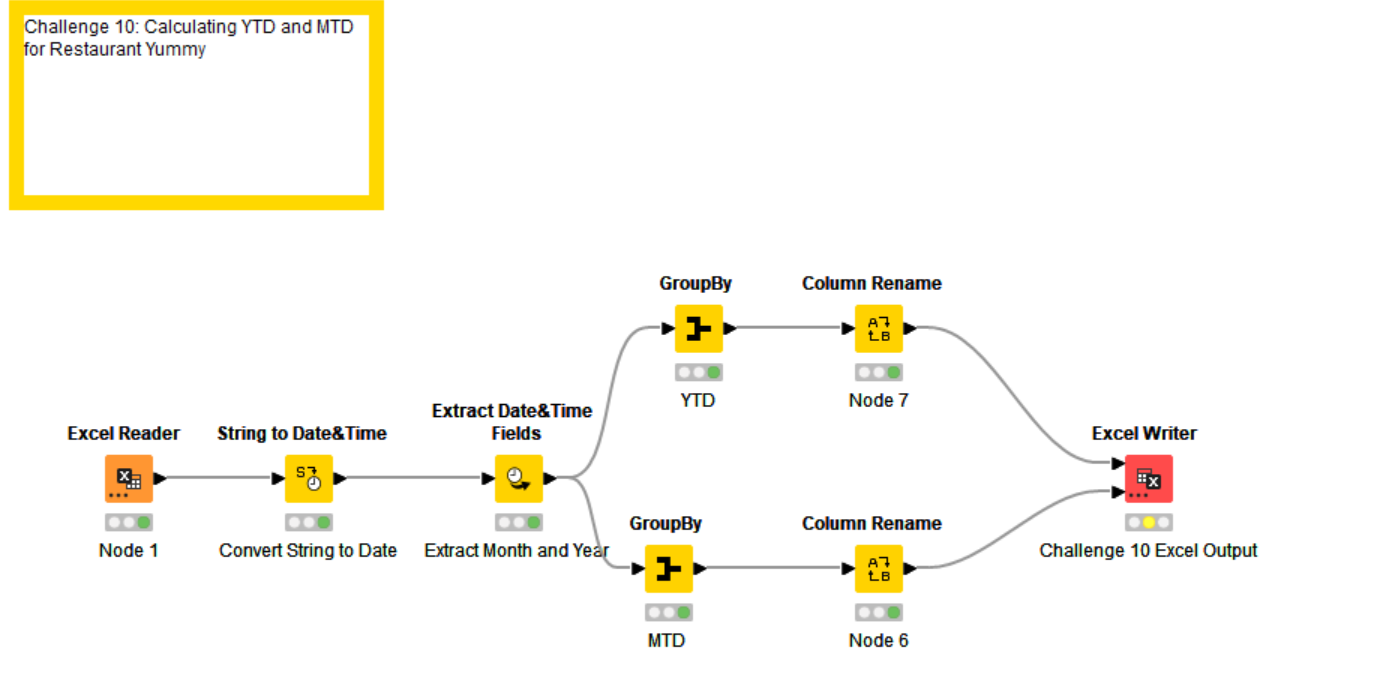
I started off the same way, calculating the YTD sales with the -Moving Aggregation- node. I extracted the month as a number, grouped by the month and took the last YTD value for each month. I guess I could have just done a sum of the sales to achieve the same result.
I then used a second -Moving Aggregation- node to perform a negative lag on the numerical month column, meaning that the month is now associated with the total value from the previous month.
I then joined these total values to the original table and subtracted them from the YTD column to calculate the MTD sales.
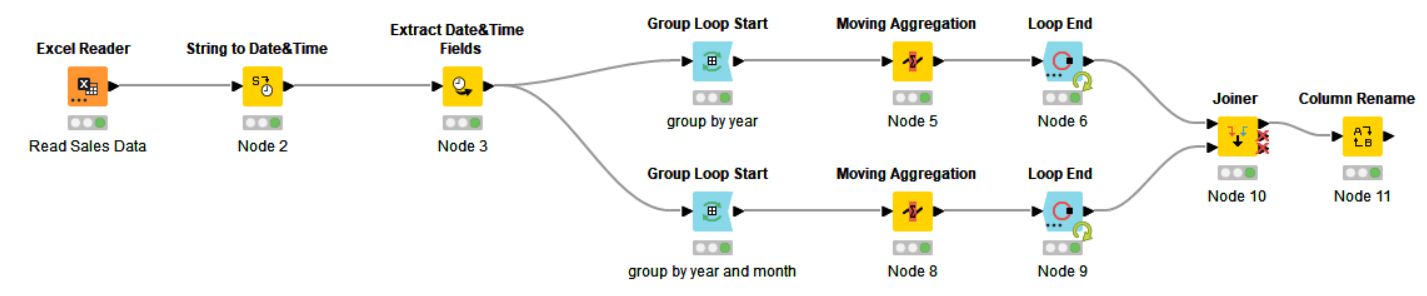
I made some extended sales data by expanding the date column in Excel and then generating random numbers in KNIME. I wanted to check the workflow could be applied to more than 2 months in the year
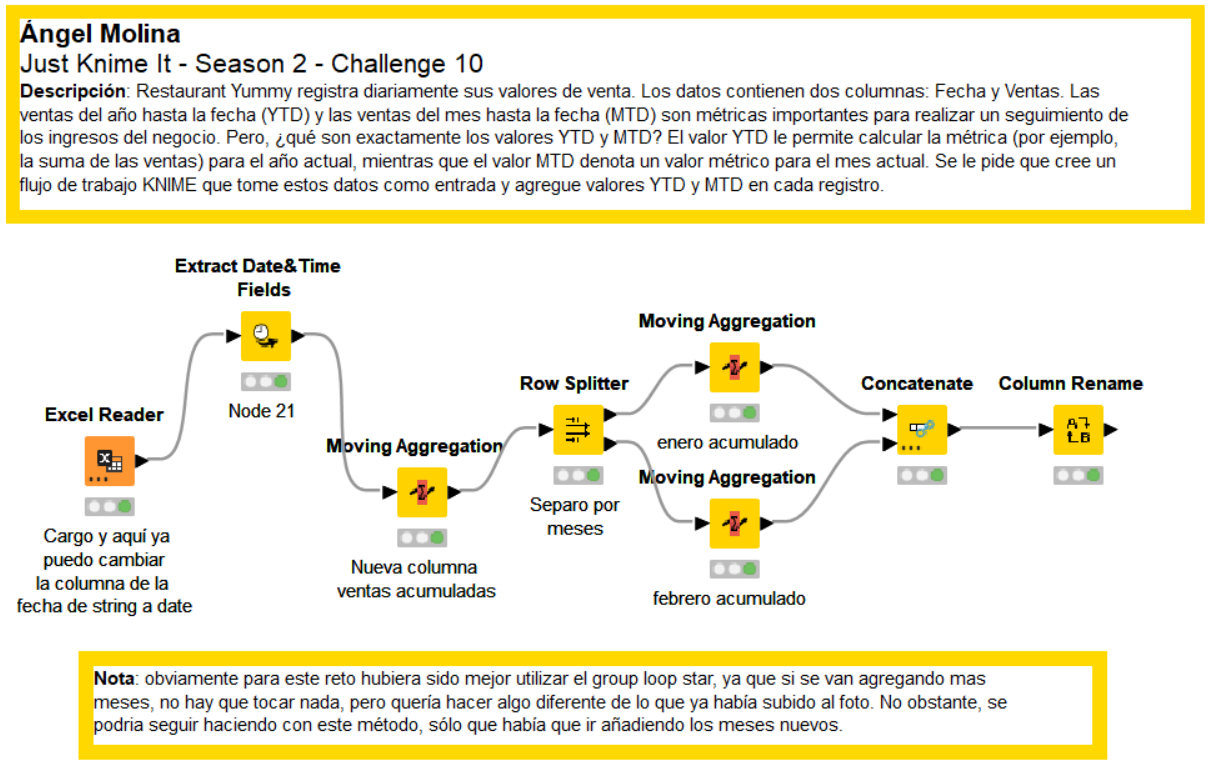
This is a very nice solution @MoLa_Data but I see a limitation here, you will have to add Moving Aggregation nodes whenever we have a new month in the data, eg: right now you have 2 nodes for Jan, feb and will need to add 10 more moving average nodes once we have data for March-Dec, Can you think of making this solution dynamic (works with any number of months)?
Oh yes, I know it’s not the best option, in fact, at the bottom of the workflow, I explain that. My colleagues already shared the best option, and I just wanted to share something different.
Thanks for comments @Mpattadkal I really appreciate your opinion.