Happy Wednesday, folks! As always on Wednesdays, we’re back with a new Just KNIME It! challenge.
Imagine you are managing your team’s work using a Kanban board to track progress. On the board, there are tickets for different tasks and each ticket can move from one stage to the next, as work progresses. As the manager of the team, you are especially interested in uncovering how much time on average tickets spend in the “Doing” stage. Can you build a workflow to handle this task, revealing bottlenecks and improving your team’s efficiency?
Here is the challenge. Let’s use this thread to post our solutions to it, which should be uploaded to your public KNIME Hub spaces with tag JKISeason4-12 .
Need help with tags? To add tag JKISeason4-12 to your workflow, go to the description panel in KNIME Analytics Platform, click the pencil to edit it, and you will see the option for adding tags right there. Let us know if you have any problems!
I was in a rush, so regarding my first thinking, I just throw the nodes there, really open for discussion how to make the solution more efficient (or right, if it’s not right )
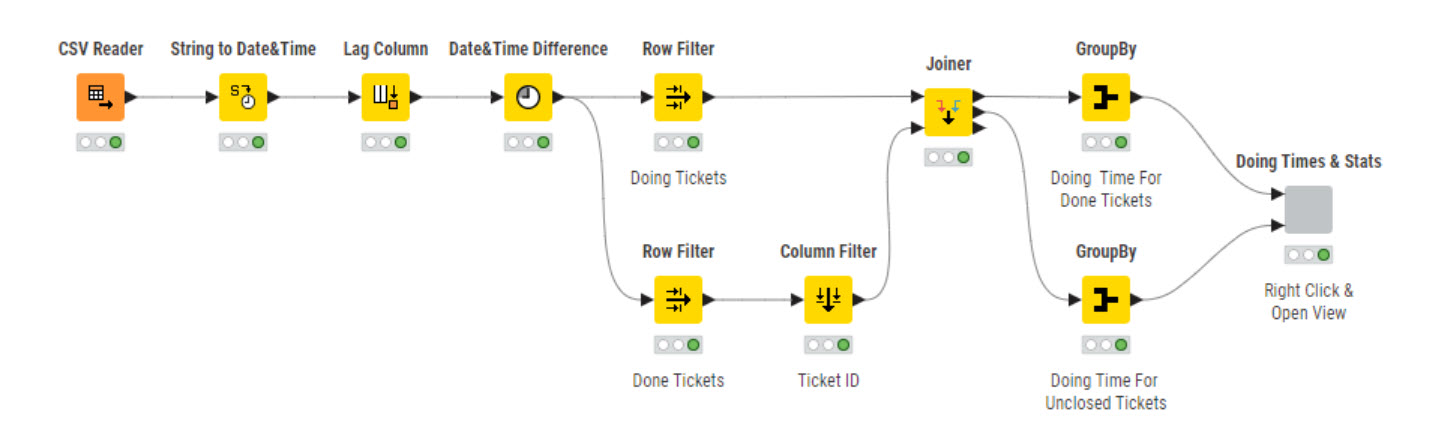
I focused on building a clear and straightforward solution, following a classic data preparation and analysis approach using standard KNIME nodes.
Steps Overview:
Data Ingestion: Uploaded the dataset via CSV Reader.
Date Conversion: Converted Moved At to proper Date&Time format using the String to Date&Time node.
Lag column: sortered the dataset by TicketID and MoveDate and created a lag column (1-1). Inserted a RuleBased node to manage Missing and “New Stage” date in the inserted lag column
Time Detection: Used the Date-time Difference node to calculate duration.
Focus on “Doing”: Filtered only the transitions where From Stage = “Doing”.
Aggregation: Applied GroupBy to sum the total number of days each ticket spent in the “Doing” phase.
Final View: Displayed the results using visual tables, along with basic statistics.
I like your approach and visu.
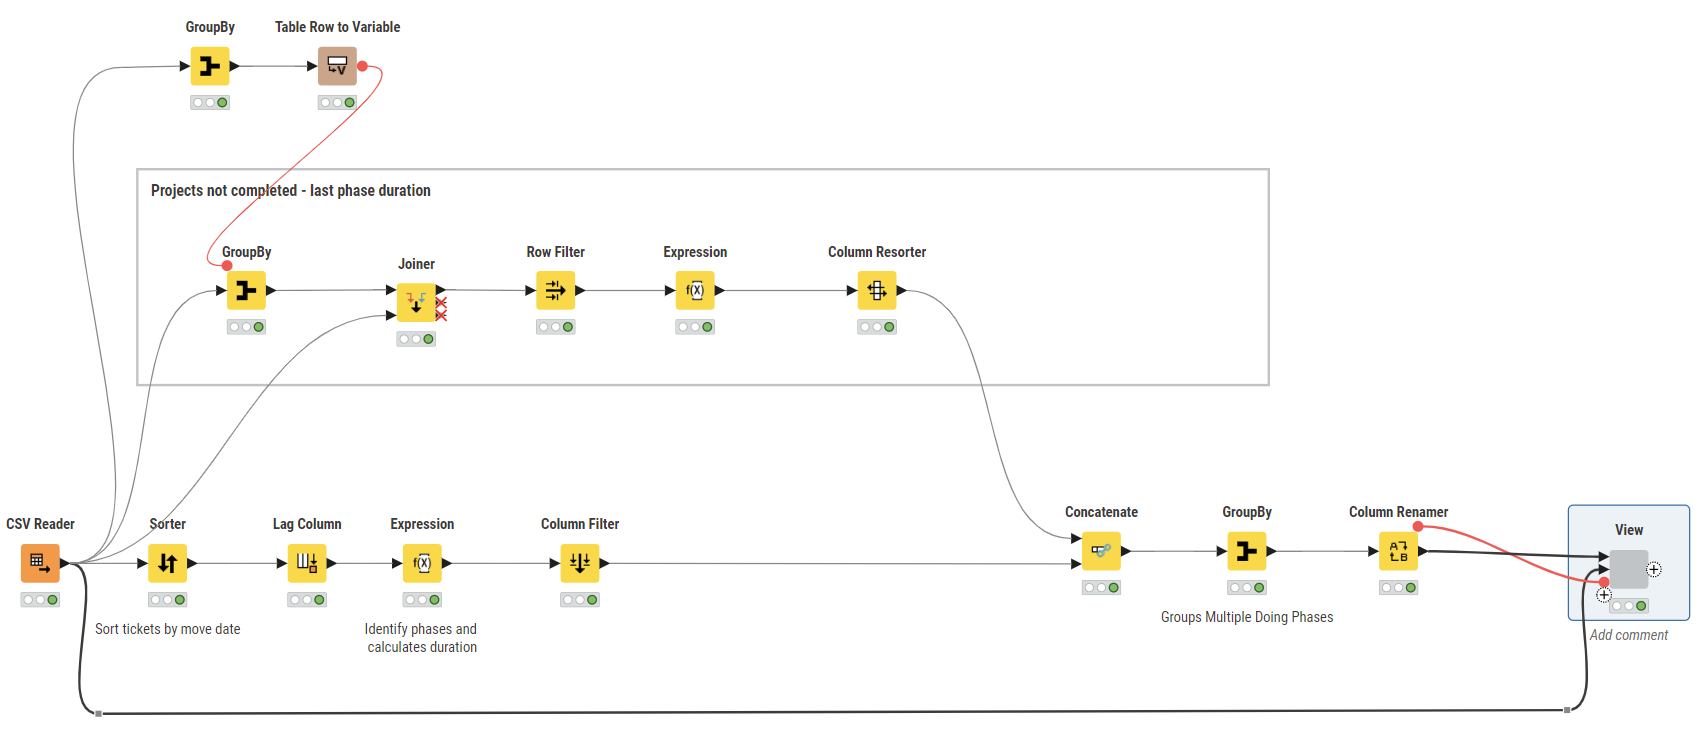
I just noticed that you are doing the time diff between create date and move date. And I think this is not correct as the create date is not moving. You have to sort by “Move Date”, then create a Lag to be able to compute the difference from when it has been moved in the category until it being moved to the next one.
Nice one this one, forcing you to work with the Lag node.
I have added a filter (simple, by stage) but might be extended. Similar with graph, always possible to do more
Here, I am using the Lag node to get the previous change of stage date. When missing, it means it is the first stage, so I get the create date. From then, I do the time diff in days. Don’t forget to sort your data first!
Present overall KPIs for all tickets, such as total number of tickets, average duration, maximum duration, and the highest number of stage transitions.
Show ticket counts by their final stage, stage-wise duration, and data-driven insights to help identify bottlenecks and their possible root causes.
Provide a ticket summary including the initial and final stages, start and end dates, total duration, number of transitions, and comments. This can help identify patterns such as tickets skipping the “New” stage and going directly to “Doing”, or tickets with repeated stage transitions, which may contribute to longer durations.
Display detailed ticket information, showing the duration spent in each stage transition.
Present KPIs specifically for tickets currently in the “Doing” stage, including ticket count, average and maximum duration, and the maximum number of transitions.
Show duration metrics for tickets in the “Doing” stage, including average duration and its correlation with the number of stage transitions.
Extract actionable insights to highlight bottlenecks and uncover potential root causes.
Instead of manually generating the insights, their generation could be automated using LLM prompts or Retrieval-Augmented Generation (RAG) capabilities.
And a big thank you to @AnilKS and @berti093 for introducing me to the Generic ECharts view and the idea of enhancing the UI with Unicode icons from previous challenges. I was able to incorporate these features into this week’s challenge.
Thanks @hanantoprabowo … Kudos to knime developer team for introducing a node which is true mirrior of knime philosophy and genesis .
Who would’ve thought a single node could turn KNIME into a serious BI contender and with KAI integration … it is really at different cloud?
It’s been a quiet game-changer—bringing charts to life and giving drag-drop dashboards a whole new meaning!
It is Not just a node… its a a stepping stone toward visual storytelling, the KNIME way. !
Here is my solution.
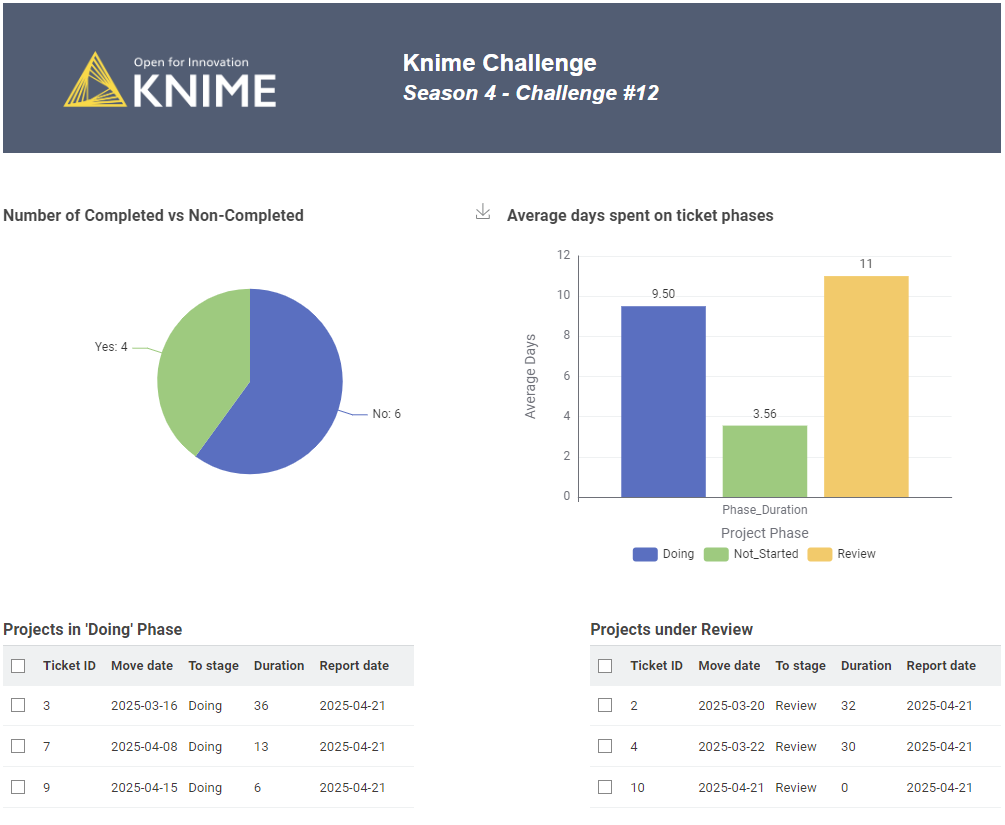
I was about to upload yesterday when I realized that projects # 3,7,9 were not being calculated in the Doing phase. Had to redo this morning…
I assumed that the report date is the same as the last record, i.e. 2025-04-21. So I calculated the duration of their ‘Doing’ phase from their move date to report date.
As I published here this morning, I realized i did the same mistake with the Review phase of project # 2,4,10. It all seems to be ok now, but I’m not really sure…The problem was that the main flow was calculating the phases duration correctly only for the projects that were completed.
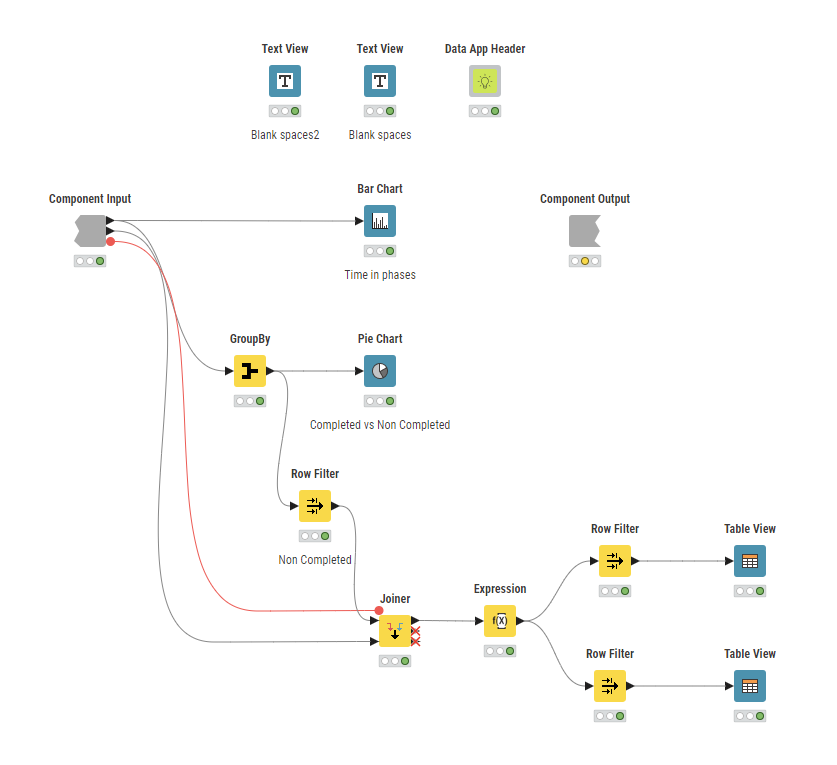
Hello KNIMERs…here is my solution to this weeks challenge: JKISeason4-12
This seemed deceptively simple and took me awhile to figure it out and eventually have to leverage what others have done. I have worked with the Lag node before but not in this context so it was good get another perspective on how to use the Lag node.
I am truly impressed by the beauty of everyone’s dashboard.
Here is my solution:
By the way, this is my 12th participation, but my entry doesn’t seem to be listed on the Leaderboard. Have I made some mistake in the way I’ve submitted my participation?
I just checked the workflow and noticed that you have uploaded this season’s solutions under your team space not your user’s.
The workflow still sees your team’s solutions but cannot match the team (user)name with any existing “individual” user so they get filtered.
I suggest to “move” (not copy) those solutions to your own space. In general, I would argue that JKI challenges are meant for individuals not teams and we have other programs for teams e.g. Game of Nodes.
Please don’t hesitate to ask any further questions.
Our solution to last week’s JustKNIMEIt challenge is out!
This challenge was a good opportunity to brush off temporal data processing skills, which are key for many different data analytics and data science applications. It was really cool to see the variety of data preprocessing ideas here, and the collaboration across you all, discussing different approaches.
Tomorrow we’ll switch gears and focus on stockout forecasting, a common problem in supply chain. Hope you can join us!