This week, let’s dive into the world of outlier detection to identify contracts that may be fraudulent based on their odd values. What visualization, statistics, or machine learning techniques can be employed to tackle this important problem? We’re looking forward to seeing your creative solutions here in the forum!
Here is the challenge. Let’s use this thread to post our solutions to it, which should be uploaded to your public KNIME Hub spaces with tag JKISeason3-13.
Need help with tags? To add tag JKISeason3-13 to your workflow, go to the description panel in KNIME Analytics Platform, click the pencil to edit it, and you will see the option for adding tags right there. Let us know if you have any problems!
I didn’t give machine learning a shot, so I just stayed with the good old outlier detection . But I can’t wait to see the sophisticated solutions from the community (as they amaze me every time)
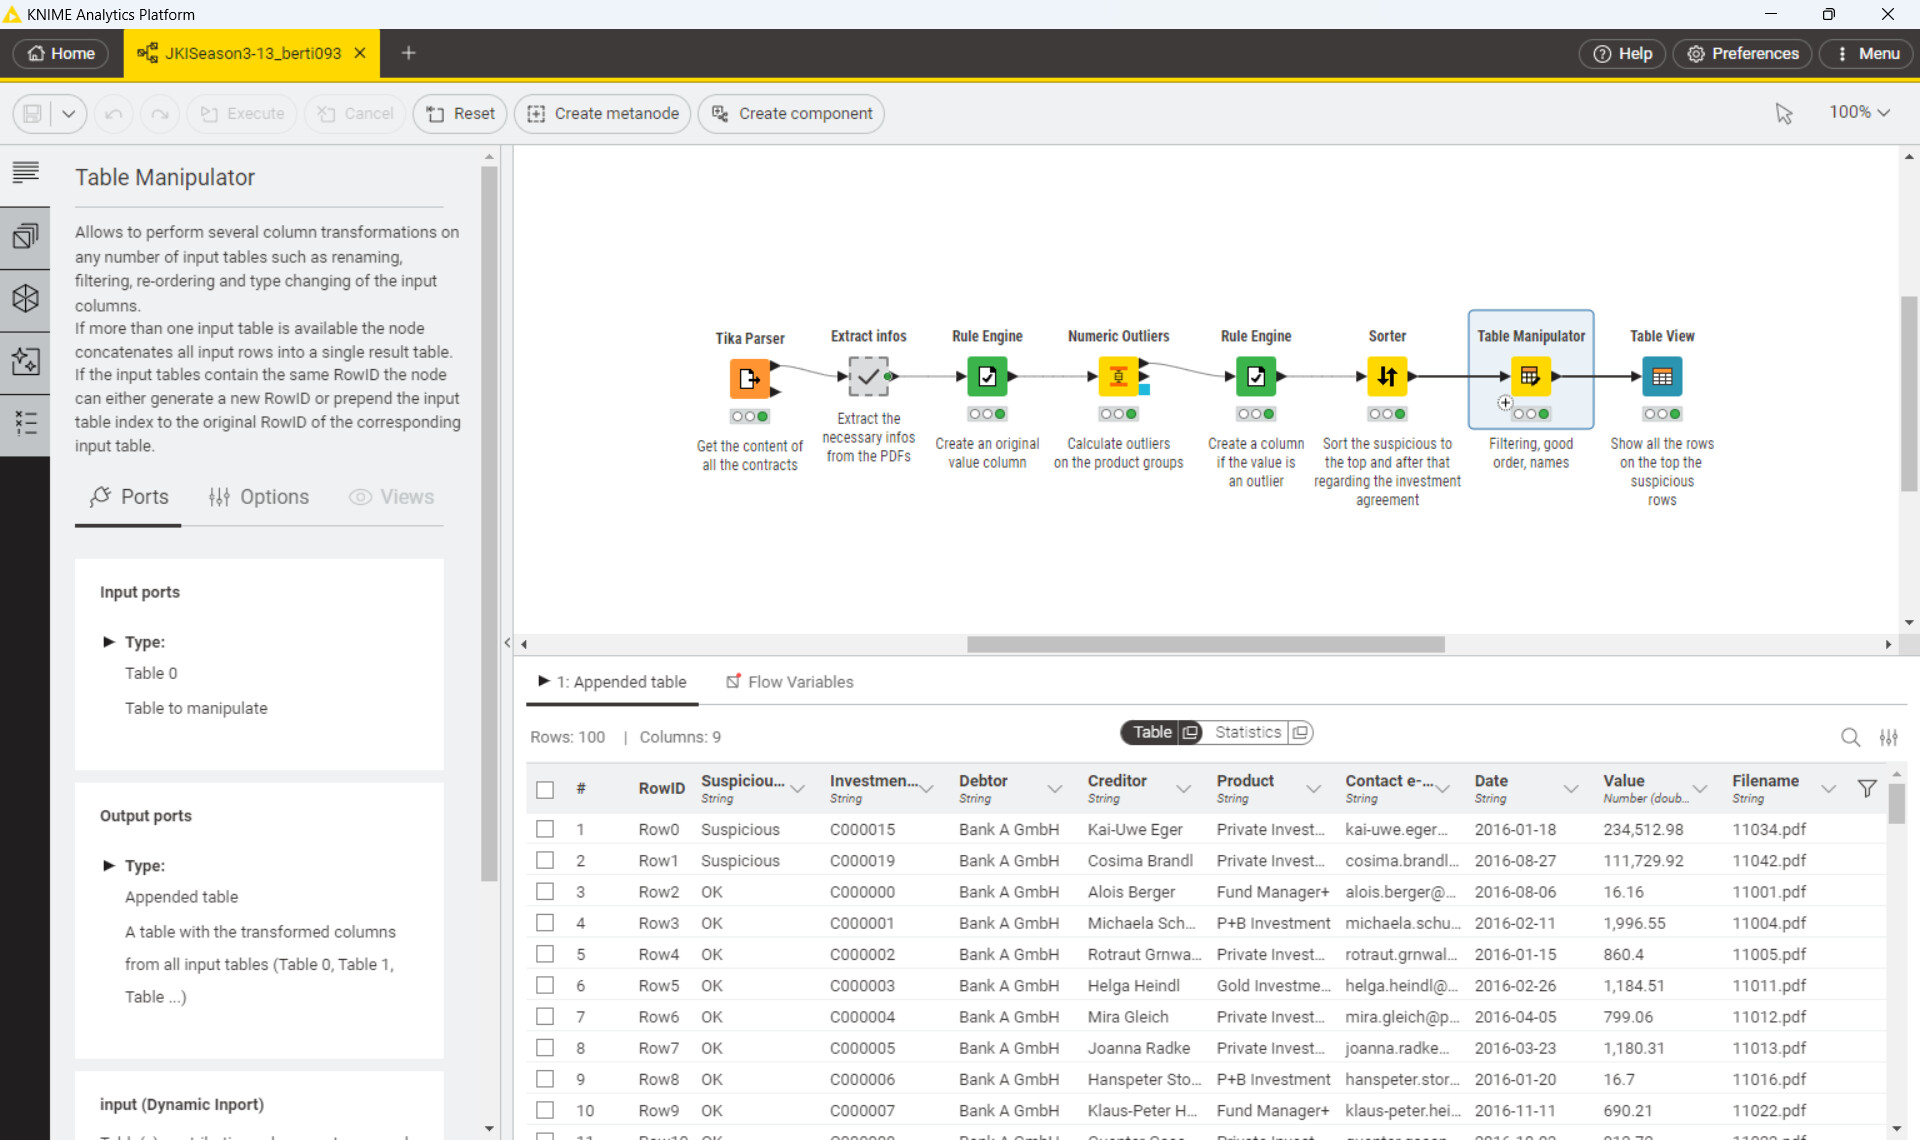
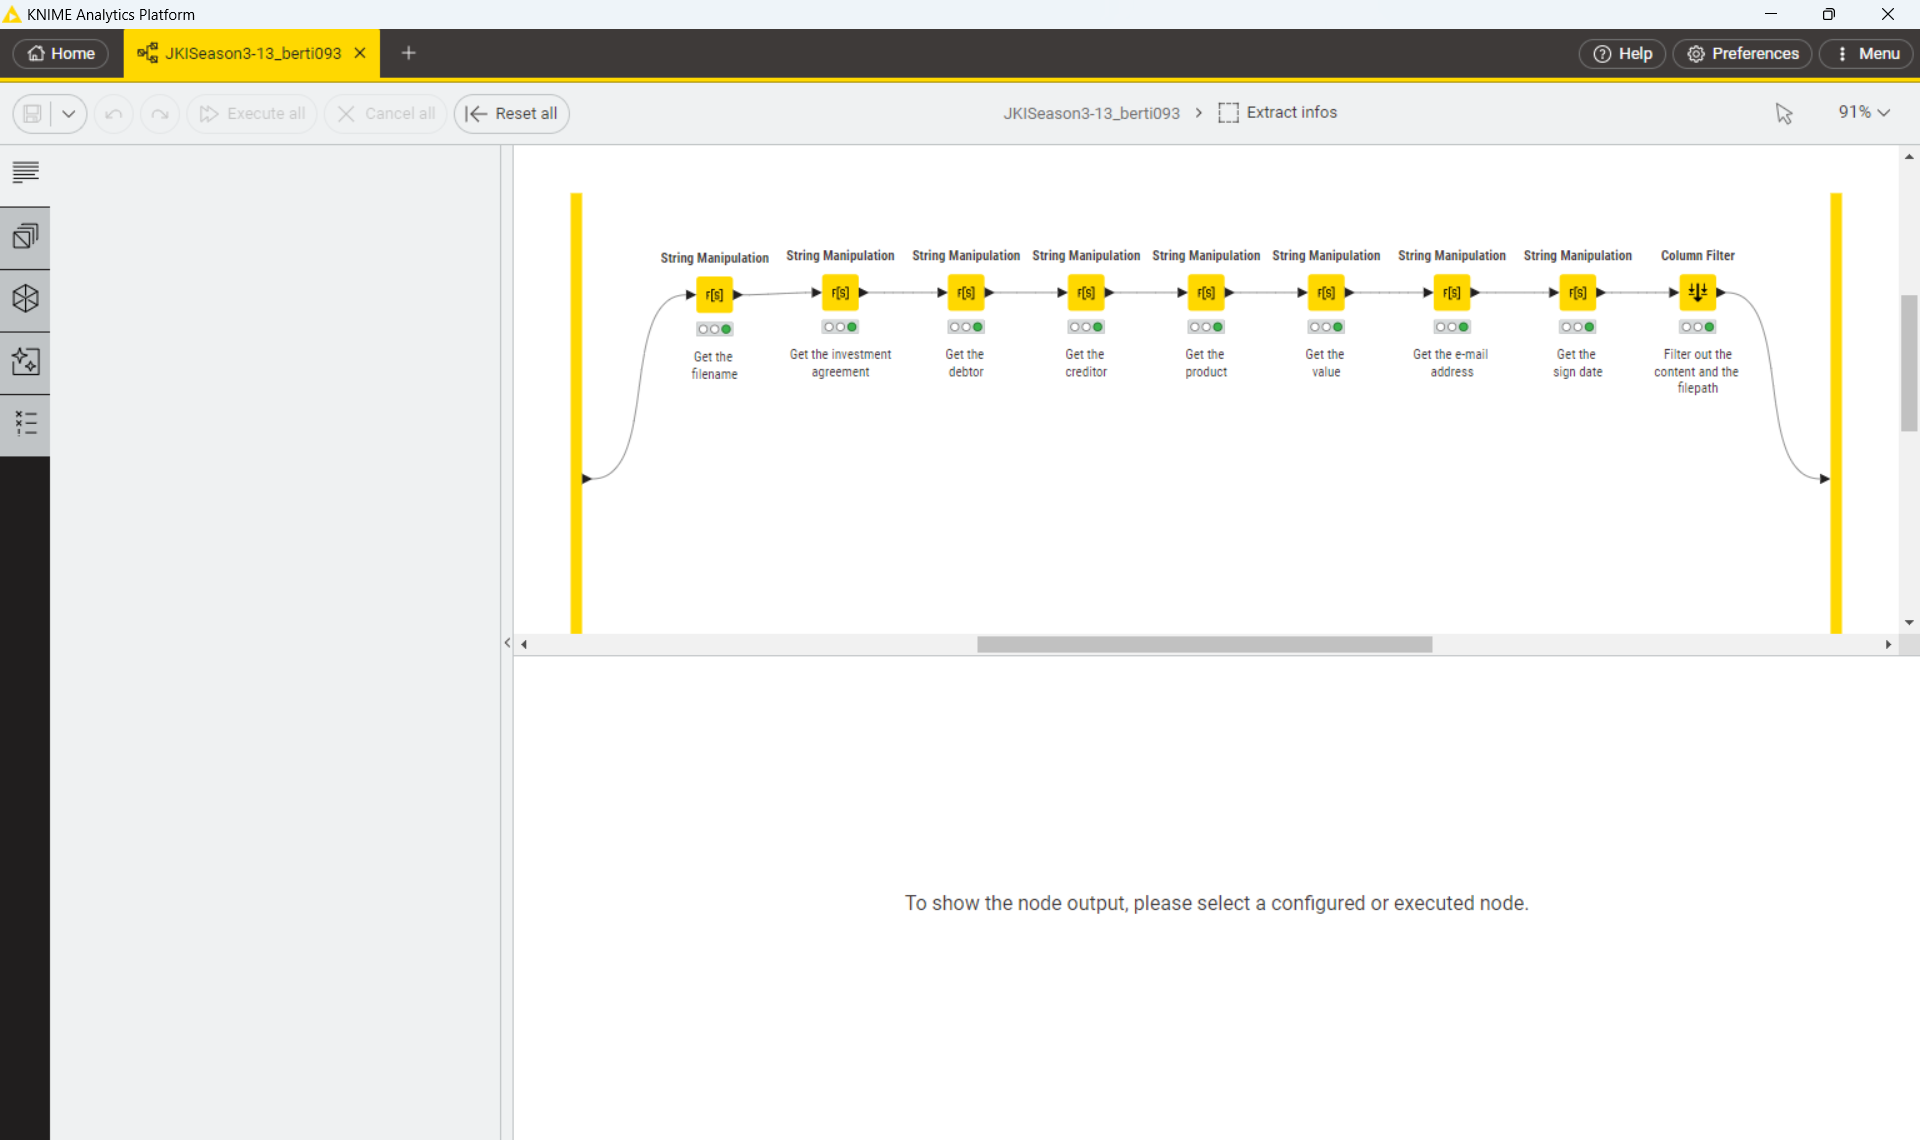
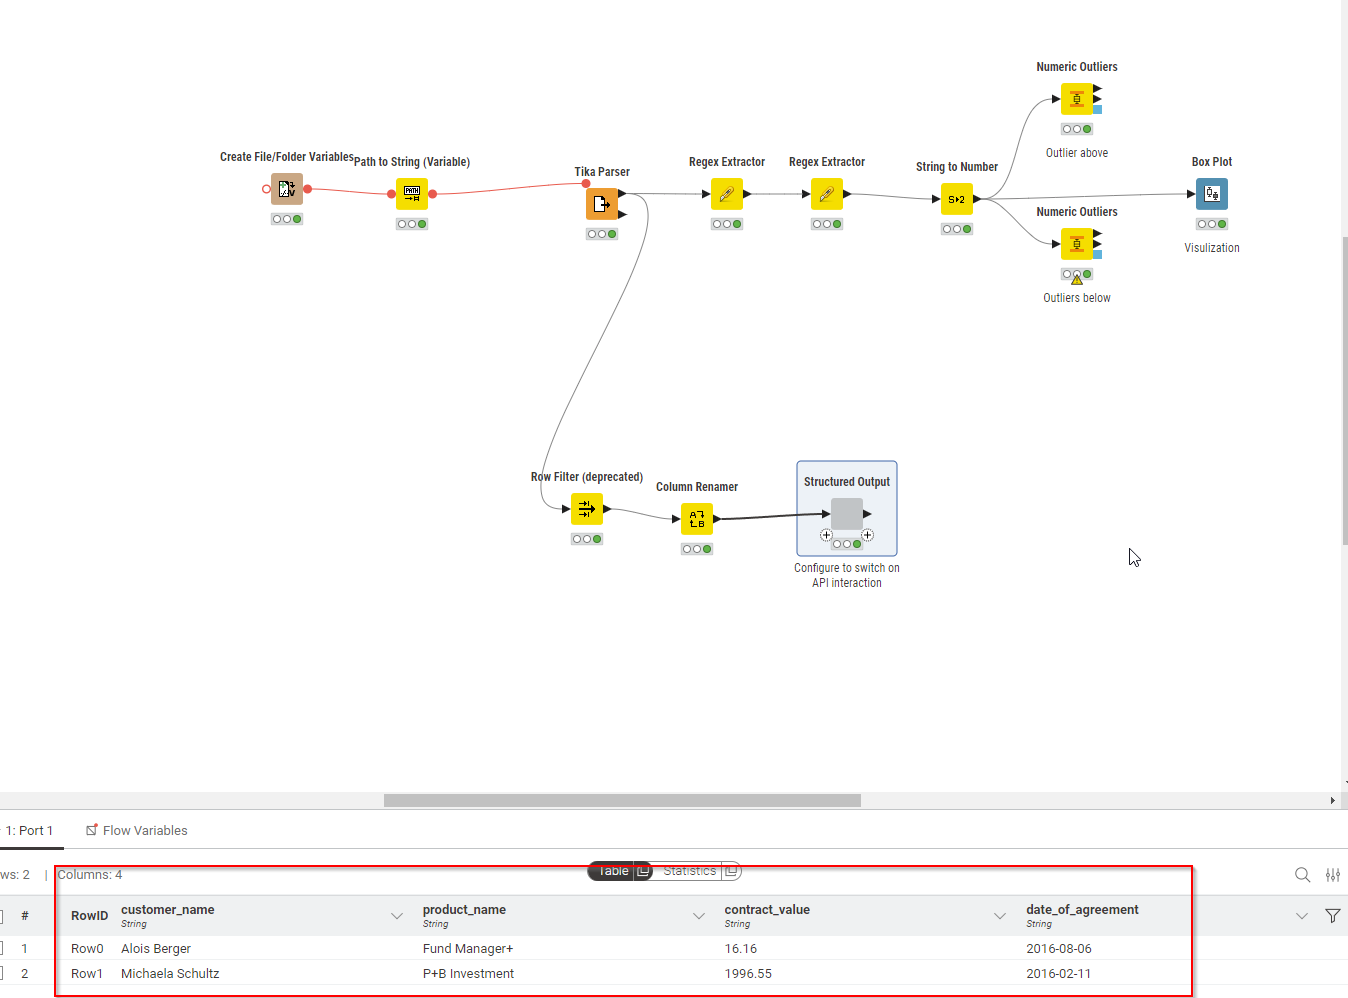
The data extraction section extracted the main information fields of the contract. But upon analysis, it seems that only the payment amount is abnormal.
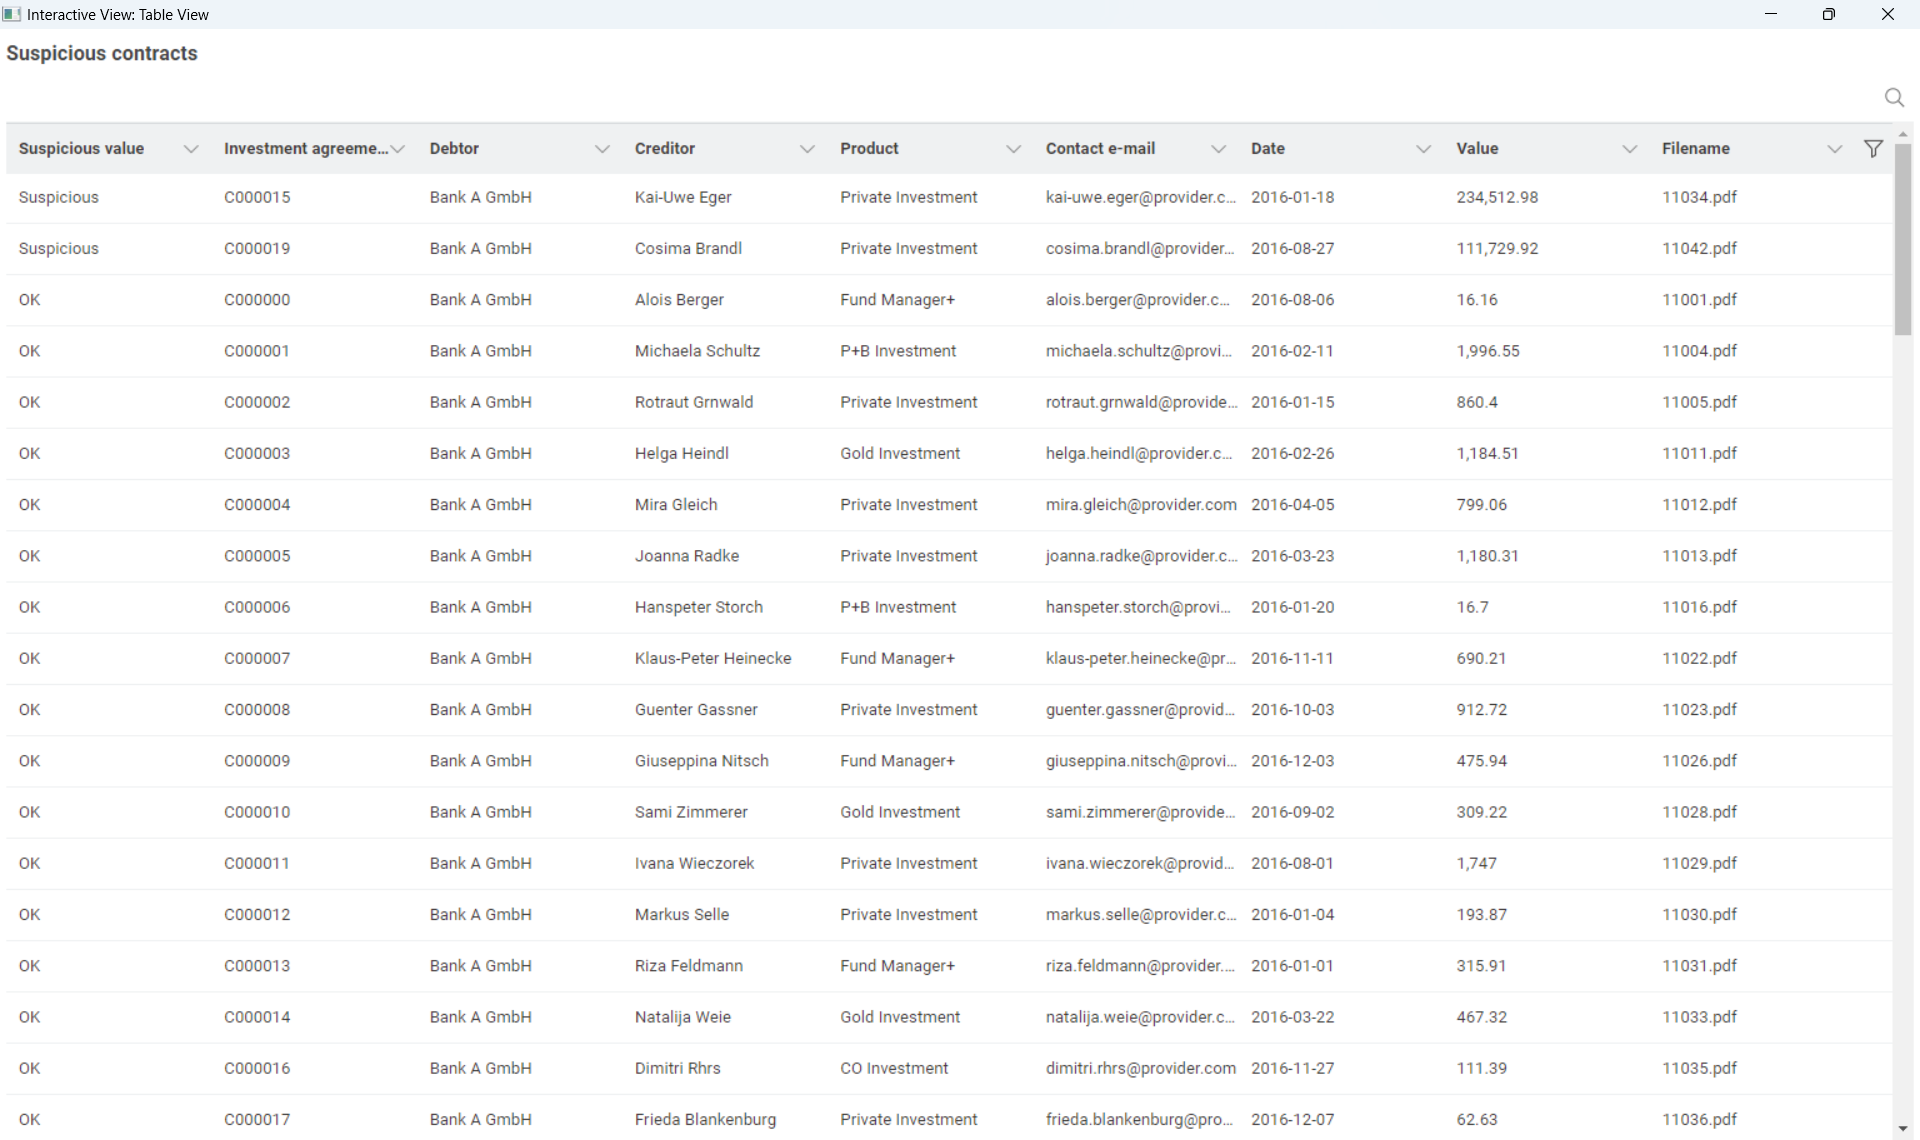
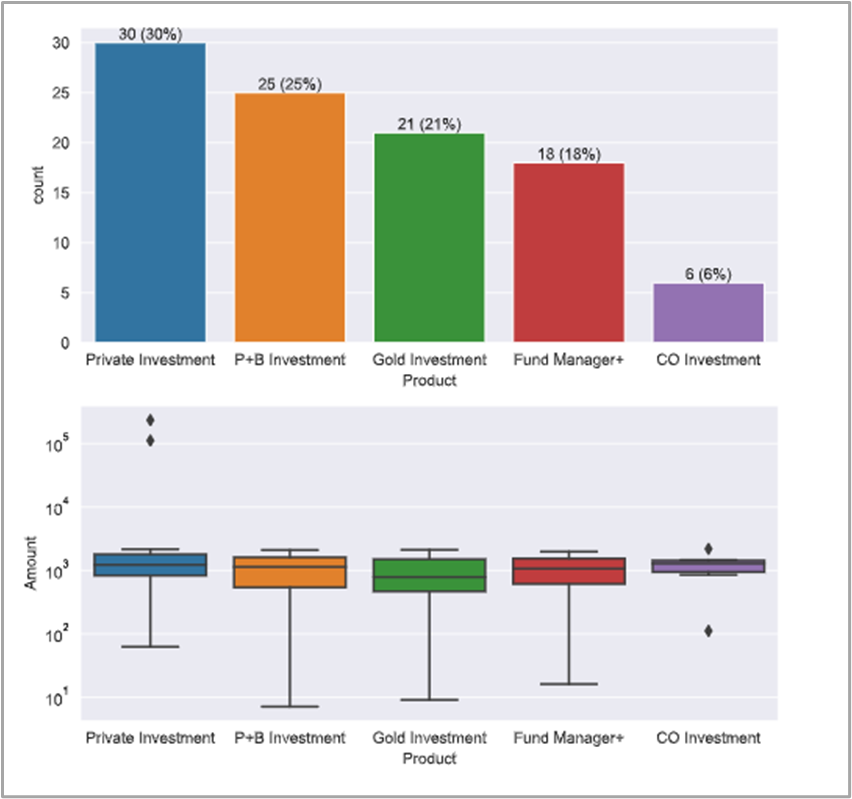
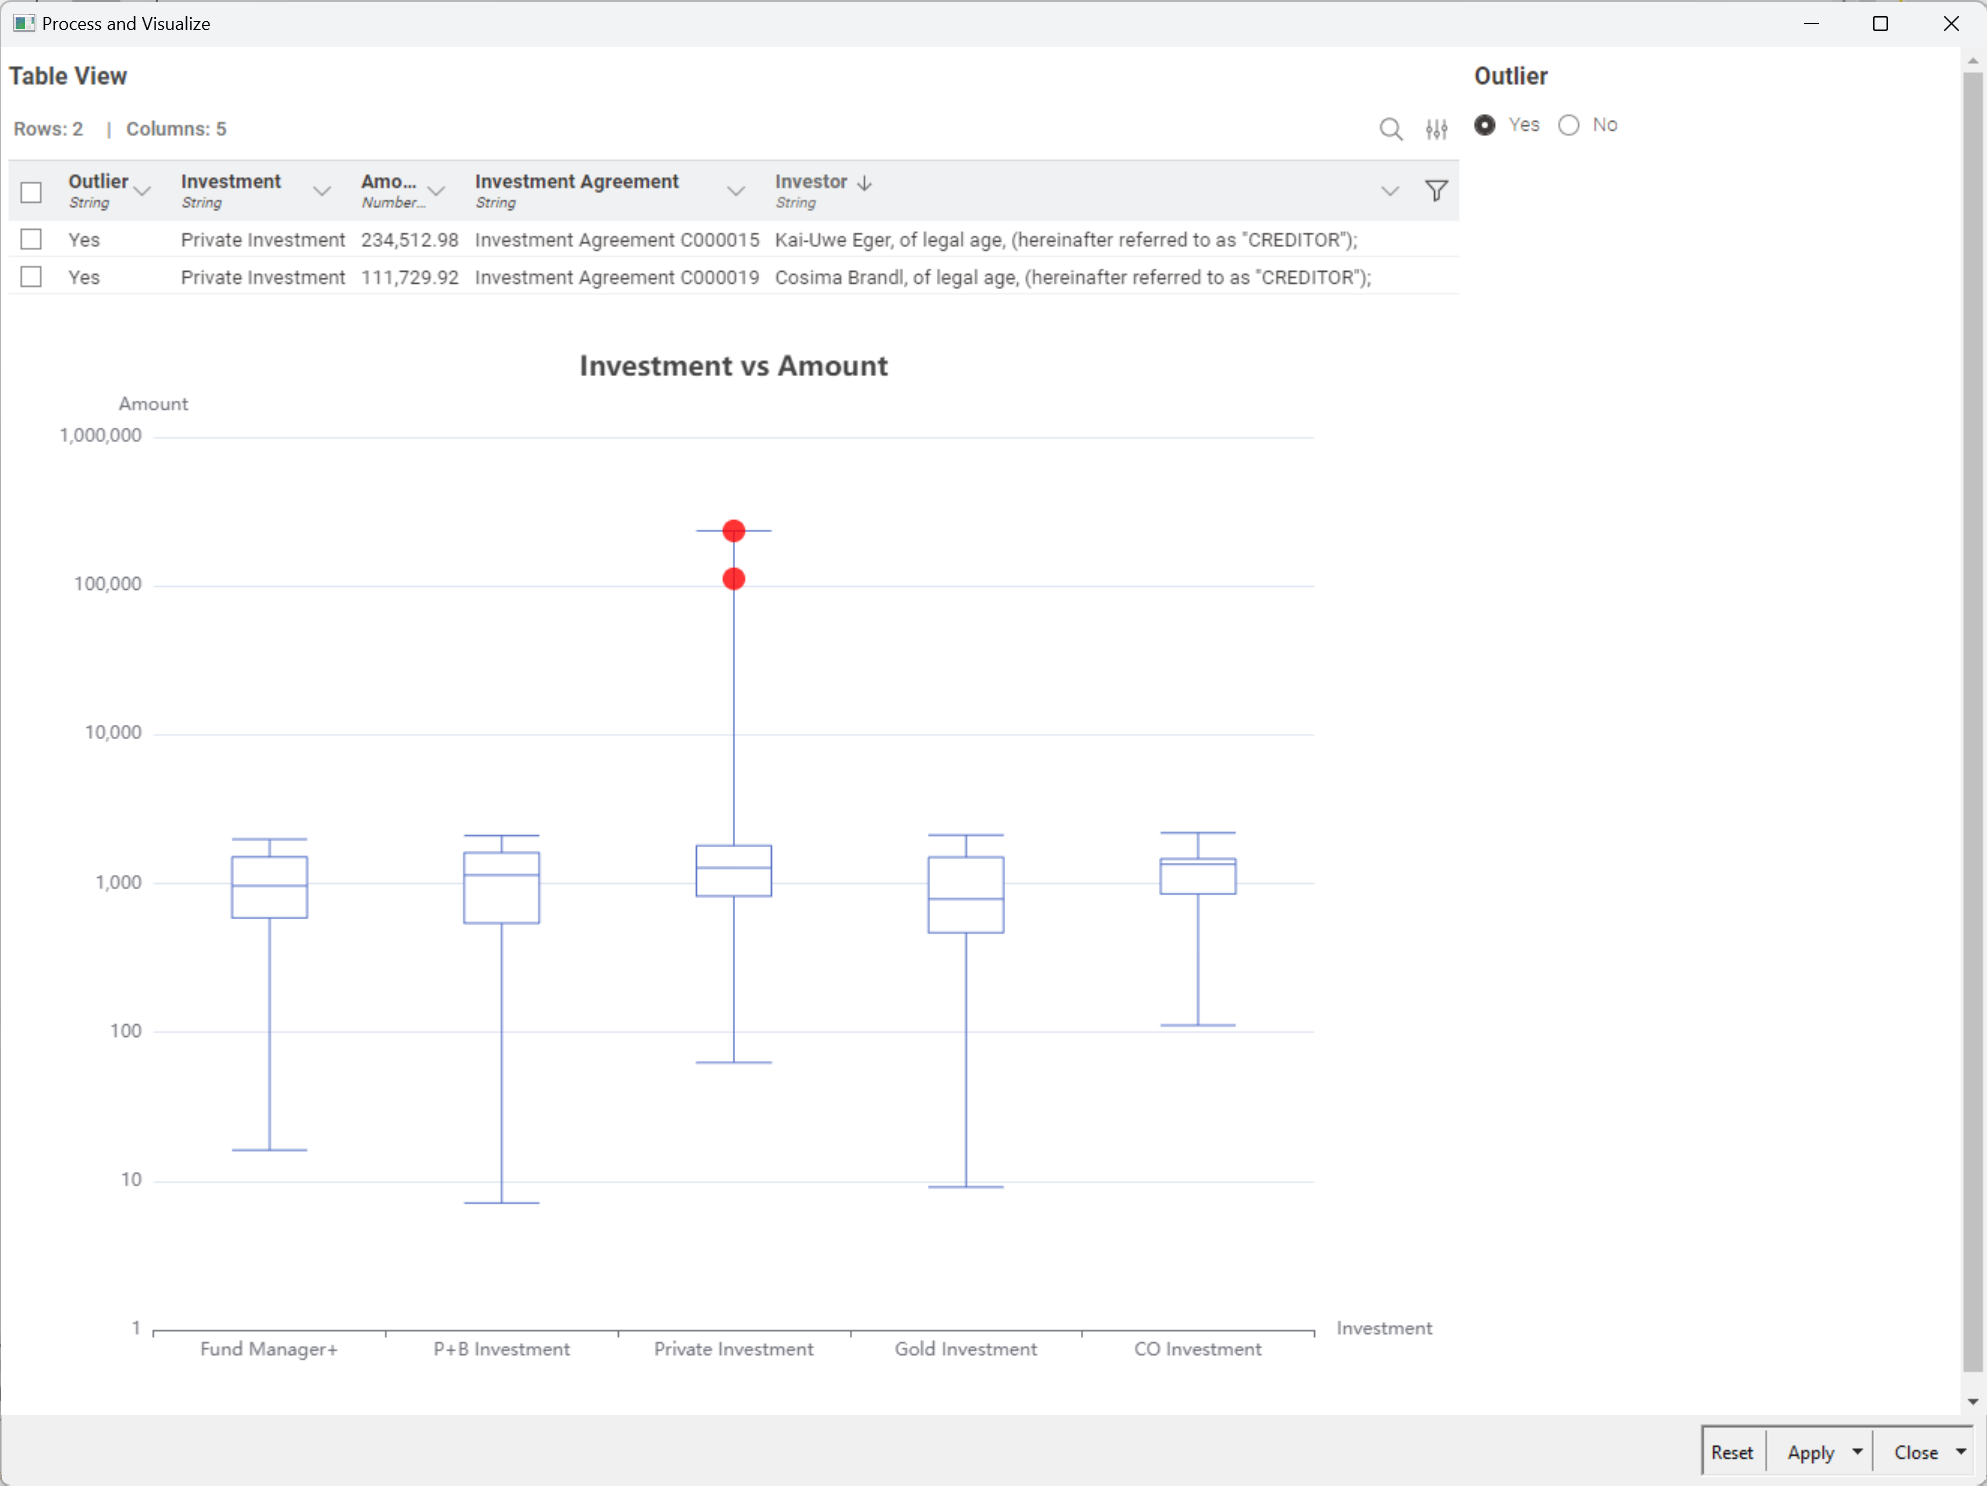
Payment amount: Indeed, there were two amounts that were too large. I personally don’t think this is necessarily fraud, it just means further business checks are needed.
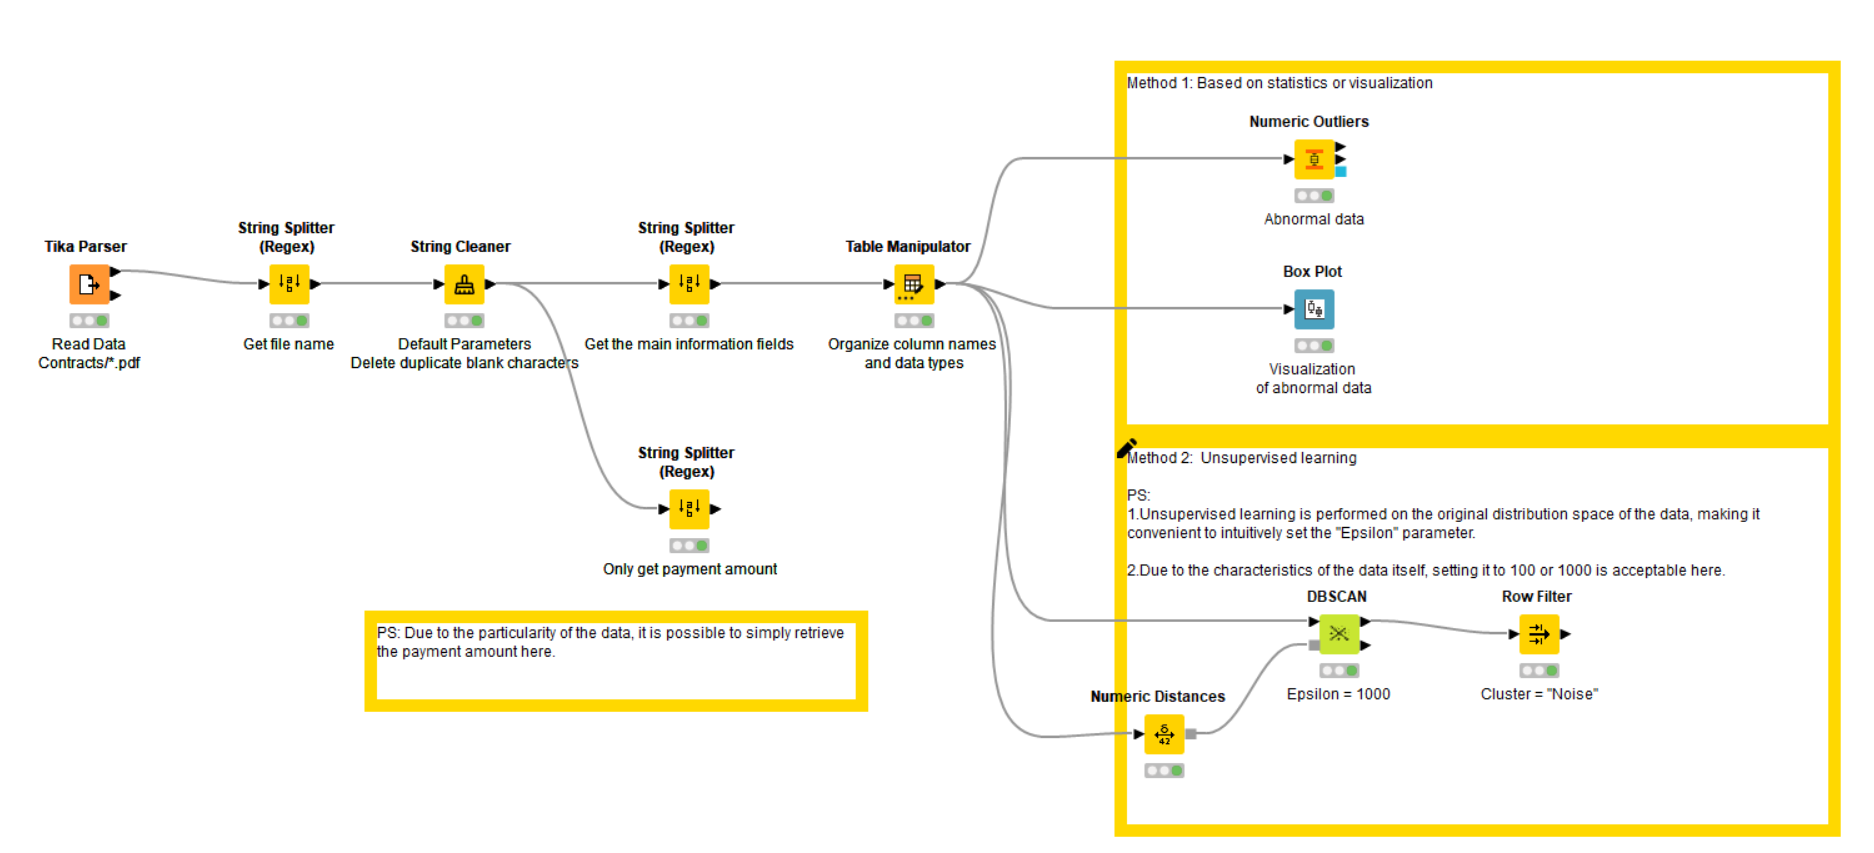
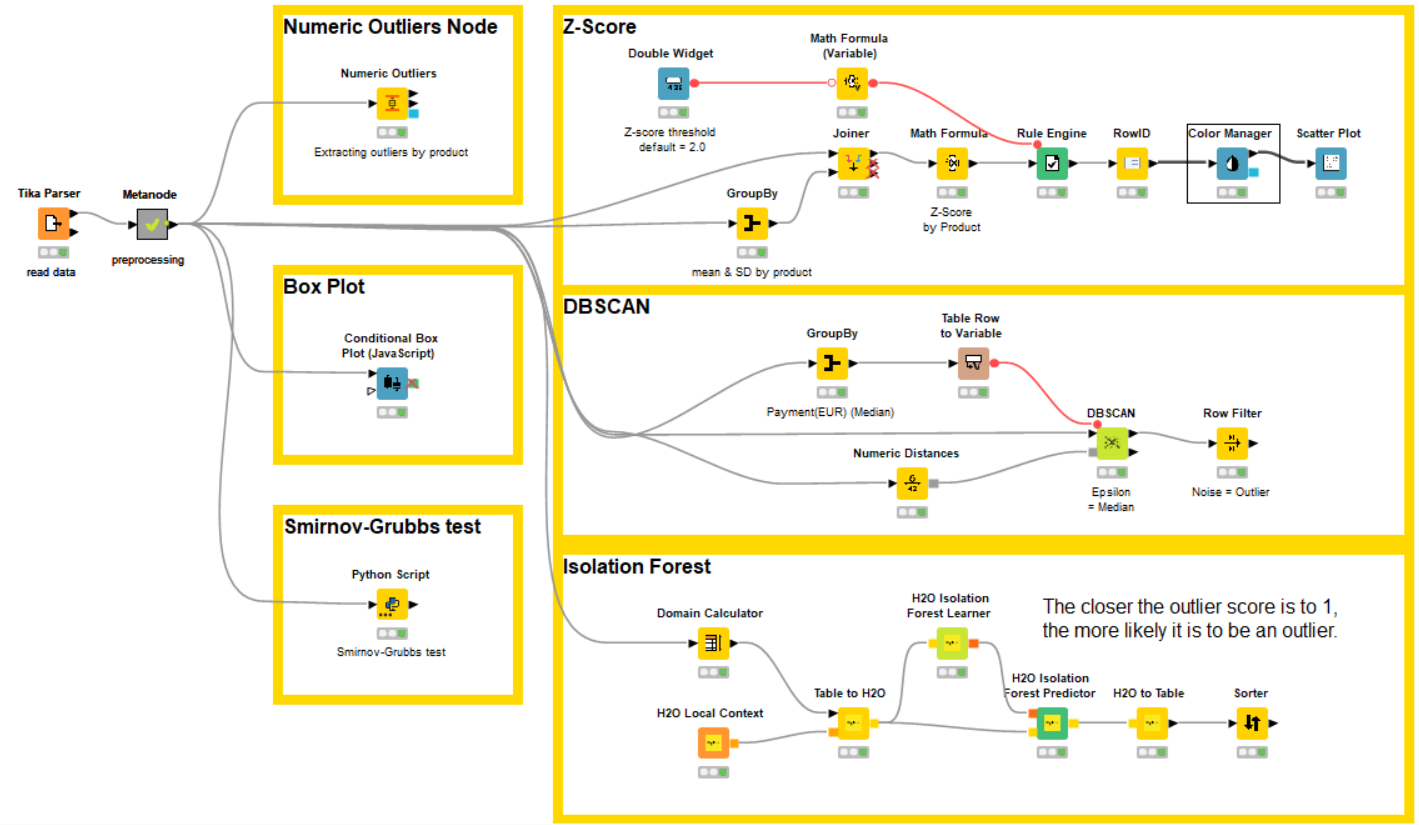
Two methods have been implemented: statistical and unsupervised learning.
Ok call me crazy, but I am currently working on a video / article about what the new “structured output feature” that was introduced by OpenAI just recently can do in a low code environment.
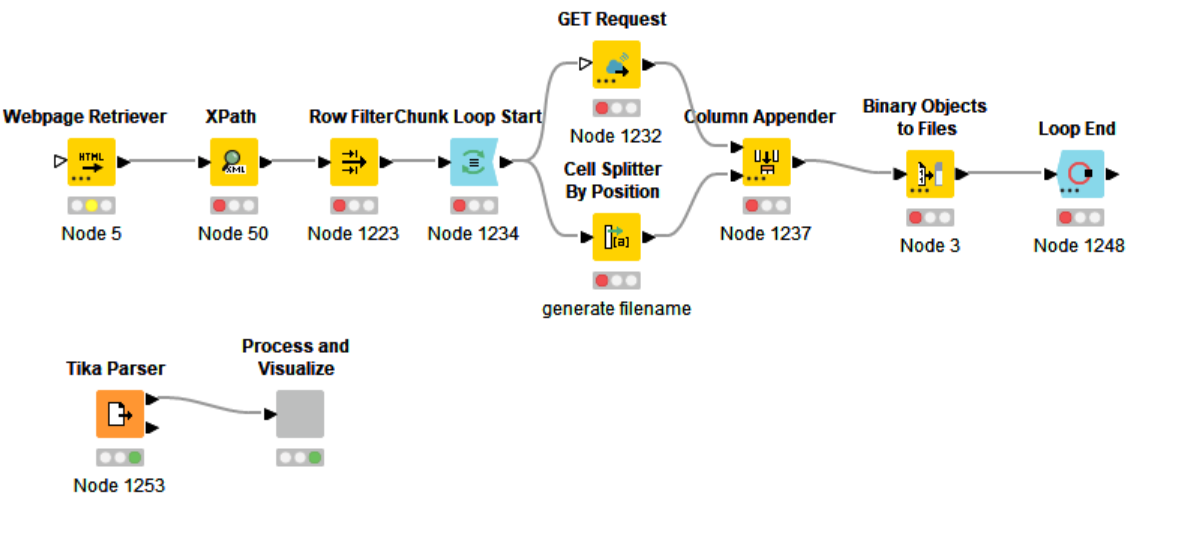
As I was playing around I noticed the example about extracting structured data from unstructured data.
I’ve uploaded a V2 of my solution that includes a component I built. One can input a response structure as a JSON Schema (I did this so the LLM looks for Name, Price, Product and Agreement Date).
Was really surprised how well this worked - that said I just let it run on a subset of the data (max 5 docs). That said - including development etc. I still have not yet crossed the USD 0.01 line (using GPT-4o-mini)
Anyways - if you want to try yourself be mindful that:
You need to have conda configured (I use conda env propagation node)
you need to enter your own API key in the configuration dialog of the component
In the config you can also change the system message as well as the JSON schema and the python script dynamically detects which fields are required and ensures to parse the data into a table with a column for each of the fields.
My (original) solution - very similar to what I have seen above.
I initially tried PDF Parser node - using Document Viewer I could inspect the document and also “match” relevant information using regex throughout the entire document, but when then using Regex Extractor Node it “only” saw the upper part of each page that e.g. did not contain price and product… Somewhat odd
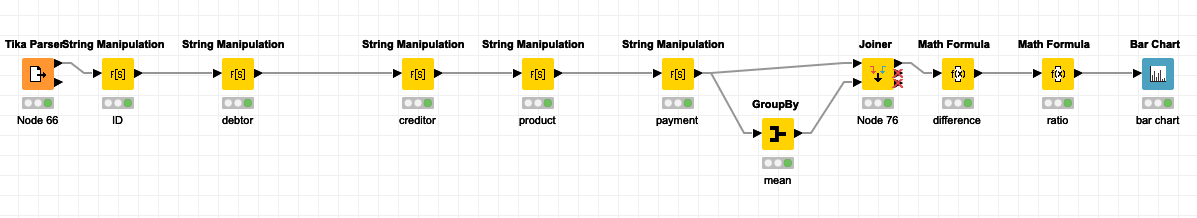
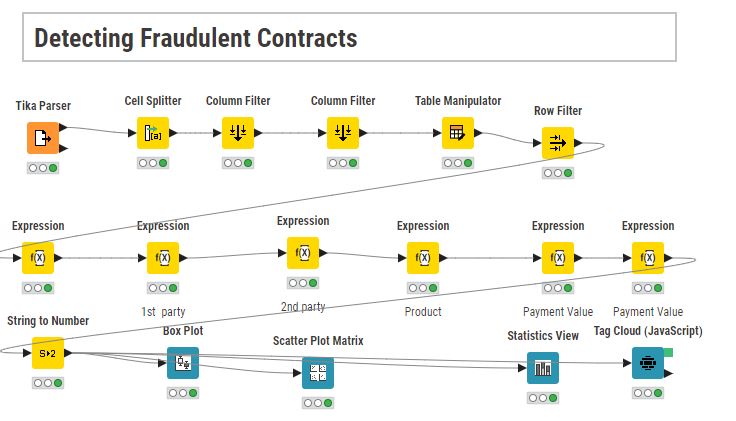
My solution is relatively simple but we can easily detect the wrong value.
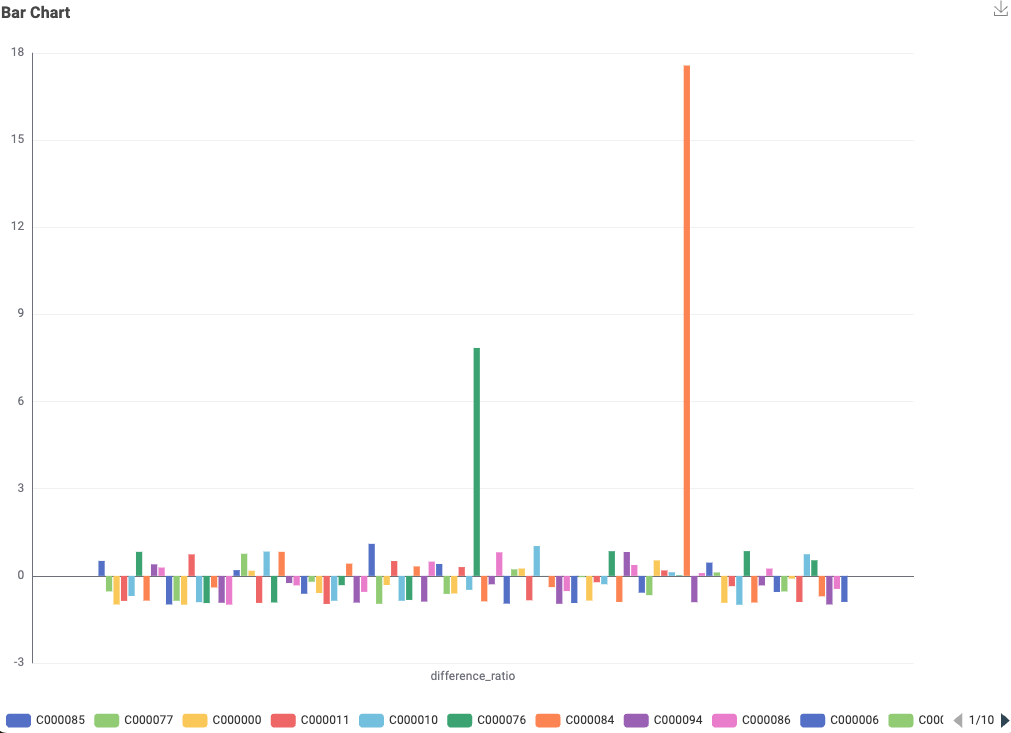
And finally, a bar chart was created showing the difference between the amount in the contract and the average amount for each product as a ratio of the average amount.
Two large bars were seen as a result!.
Hello everyone,
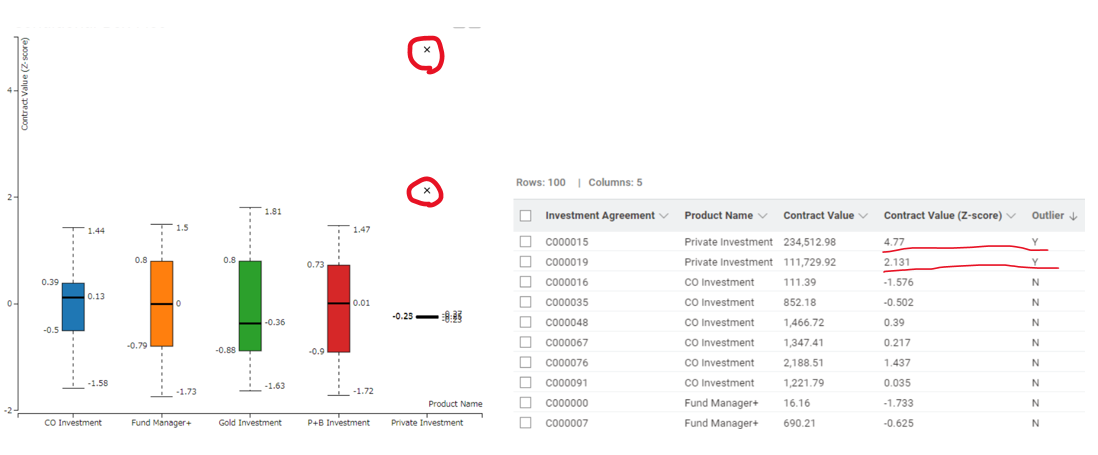
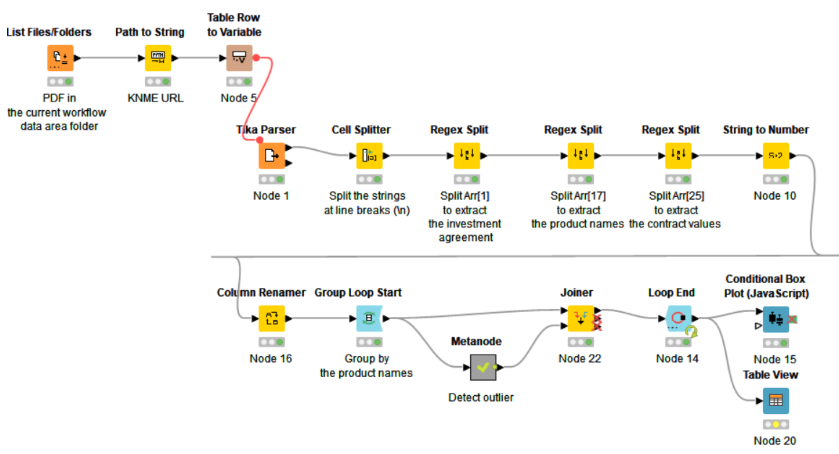
I used conditional box plot to visualize the outliers in the contract values. The contract values were grouped by the product names and normalized to Z-score before visualization. Thanks.
Hello @ JKIers
I love this challenge (regex extraction, Py analytics, tons of learnings…)
After exploring quite many approaches I finally decided to go on Py scripting. The result as many others based in statistical outlier detection; achieved on ‘Tukey’s range test’ with simple coding.
Hi, @MartinDDDD !
I’m very interested in learning your solution, but I can’t find the regex extractor node.
Could you please tell me how to get an extension or the node, so I can read how the node works?
Currently, I use Knime 5.0 version.
Hello back again,
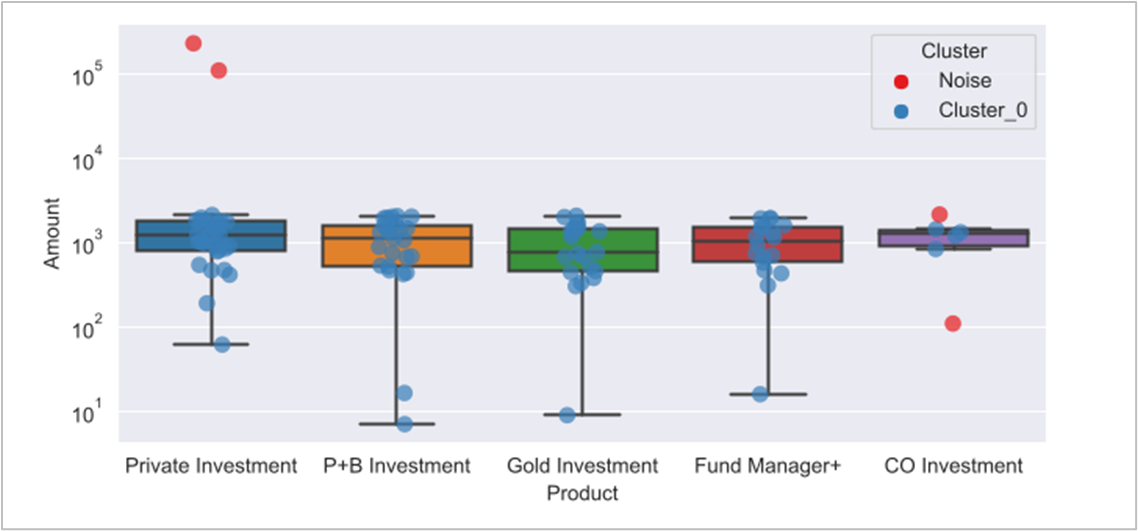
I’ve upgraded my workflow aiming to compare or replicate the results, from my initial Tuke’s approach vs KNIME DBSCAN method.
On a first view throughout results the data, I don’t think outliers on ‘CO Investment’ product are representative, due to the low number of samples, currently 6. But they are needed aiming to test the validity of the method.
I’ve learned that DBSCAN node is hard to set due to the sensitivity of Epsilon distance; I finally set it in 500 for this exercise.
My conclusion is that ‘Tuke’s range test’ is easier to apply, as it doesn`t need forward research for parameters; and it fits on what you expect to see out of IQR’s whiskers.
I tested the same, working with the Numeric Outliers node. Setting as ‘Full data estimate’ using R_3, I could attempt to catch 3 outliers out of the 4.
I recently had an absolute nightmare working out what was going on with my regex (non)matching, both in the String Manipulation node and the Regex Extractor mode. After hours of banging my head against it, I found it was due to new lines. As always, once you know what the problem is, the solution is frustratingly simple.
Stick a String Cleaner node in front of your Regex Extractor and ensure line breaks are removed. There are also a couple of things in there that look like a good idea for most text such as leading/trailing white space removal and duplicate white space removal etc, but the main thing is the line breaks.
Here’s the solution we just posted for last week’s Just KNIME It! challenge.
Upon statistical and visual inspection, we found two contracts that may be fraudulent based on their values.
We are very grateful for your very nice solutions – especially when it comes to the creative visualizations! See you tomorrow for a challenge on avocado prices.