I am again struggling with one task
I have data where I should take sum of data, but this aggregation should be summed up daily, weekly, monthly by each user
The idea of how you are solving this sounds right, so I’m guessing it is a small mistake in the config for one of the nodes.
Looking at your “mine.xlsx” sheet, it appears to me that it isn’t the aggregation that has gone wrong, but that somehow the whole data that is against your name has also been applied to “Ainur”, so is it maybe an issue with a join somewhere?
e.g.
“mine.xlsx” sheet - here I included only two employees and here only names are different, the rest of data are same. I have added one more employee, in order to show that the there are other employees and they also should be grouped by employee as well
Yes, I can share , but seems like my workflow kinda mess ) case.knwf (89.4 KB)
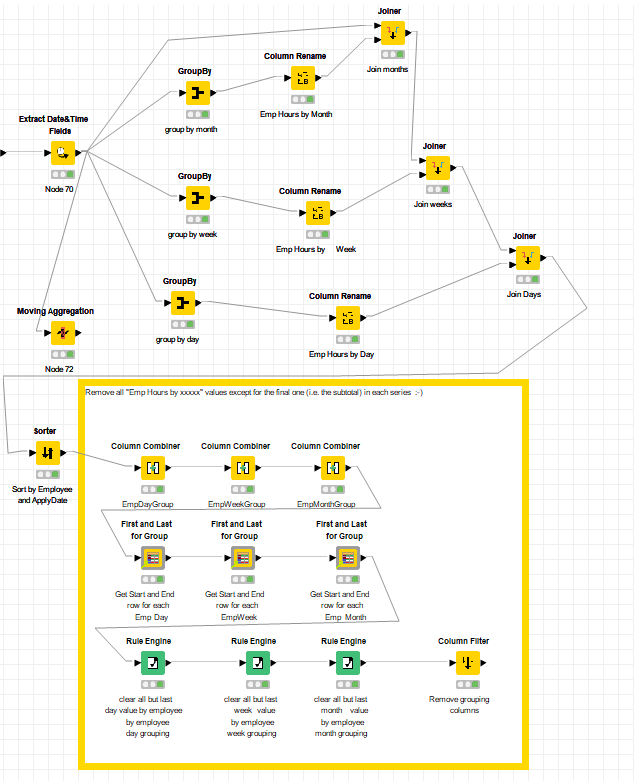
I think I can see a likely issue. Probably it shouldn’t actually be concatenating those groupings, but should instead be joining them each individually to the main flow, using the grouping columns (Employee Name + week/month/day column) in the aggregations as the joining key. I believe that what was happening in yours was that the concatenated (grouped) data was being joined back but against just Employee name so was being multiplied up to a large number of “duplicated” rows.
I couldn’t actually run your flow without the data file, but I’ve tried to work it through anyway. Attached is some logic for just that part, using the sum.xlsx from your initial post, so you’d have to play around with some of the config but hopefully it makes sense.
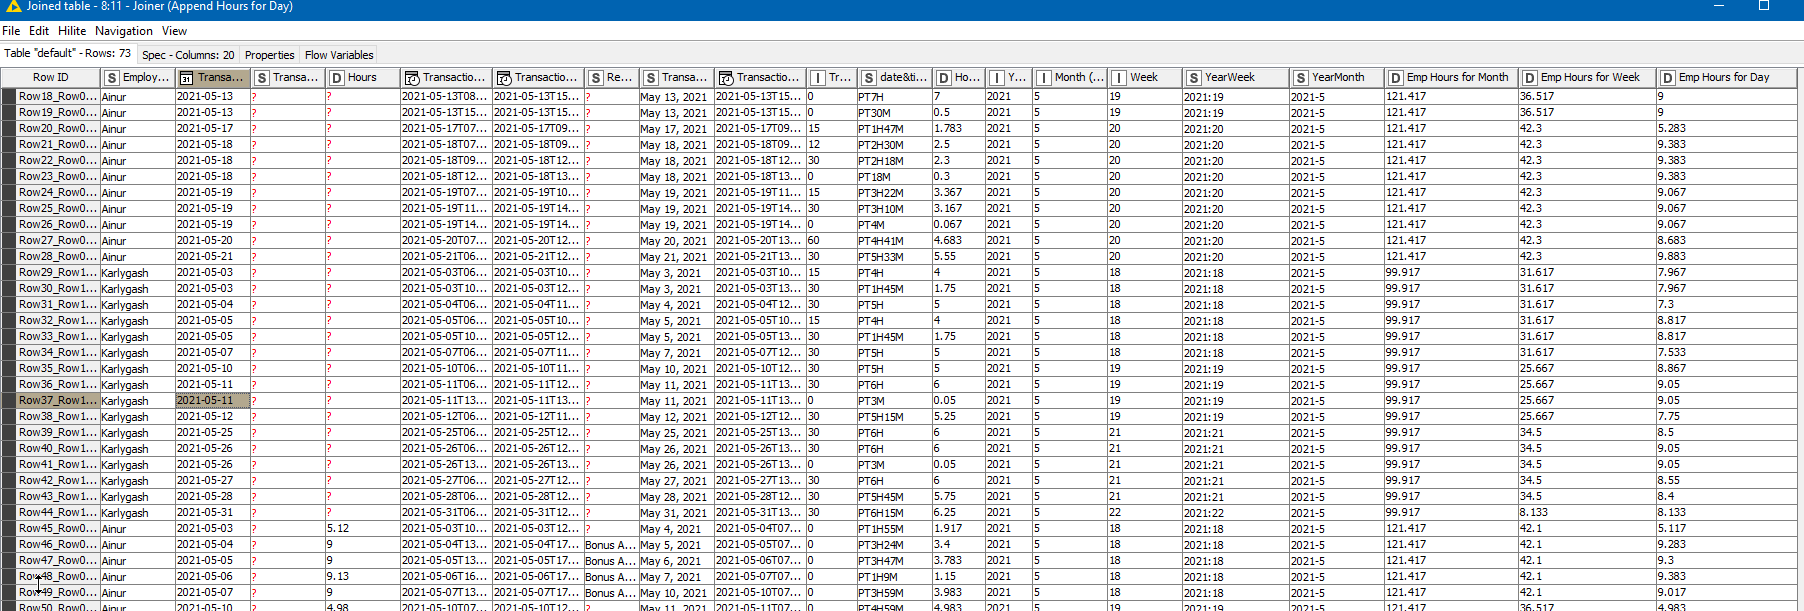
The input data was 73 rows, and so is the output, which hopefully is what you require. Onto the end of each of the rows it has appended Emp Hours for Month, Emp Hours for Week and Emp Hours for Day
The group by was done much the same way that you did. I chose to make keys out of Year+Week and Year+MonthNumber, only because it future proofs it if you ever had data for multiple years.
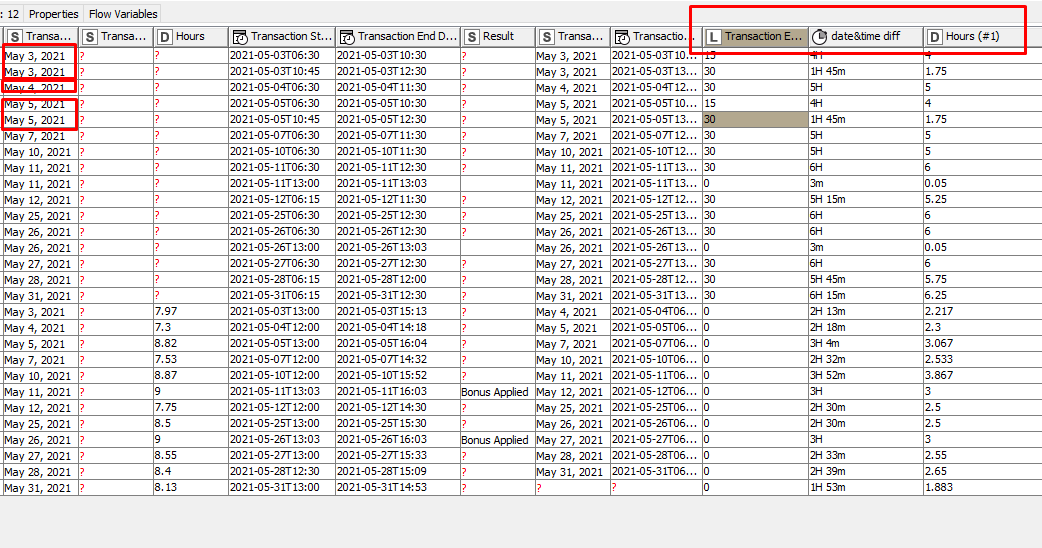
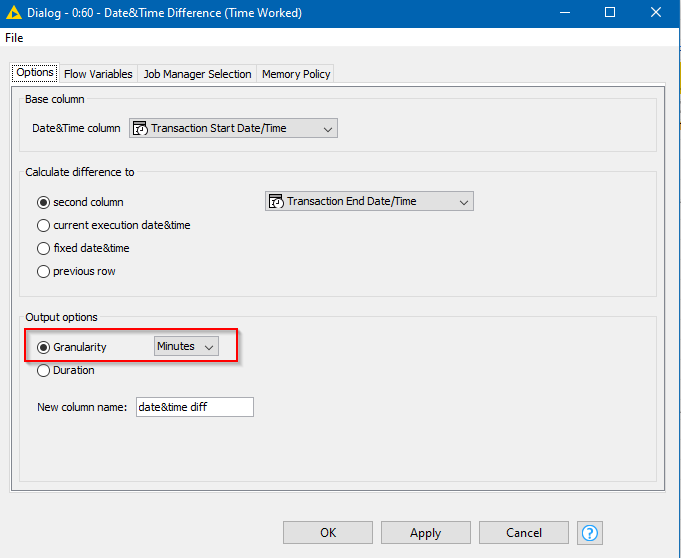
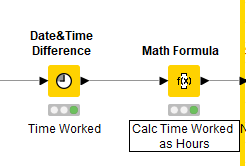
A question that you posed inside your workflow was how to turn a Date&Time Difference from 3H 15M format into 3.15.
This can be achieved by changing the config to return Minutes rather than Duration
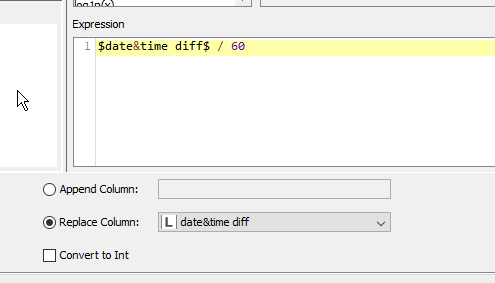
and it looks like you then need to use a Math Formula node to divide minutes by 60, unless anybody knows a shortcut! (Returning it as hours seemed to give me just hours as integers)
I hope buried in the above are the answers you need, but obviously fire away with more questions if you have them.
(Though I should warn that I am meeting some friends in a pub in London this evening for the first time in over a year, so don’t believe anything I tell you tomorrow! )
oh, sorry. I have just seen your reply
Thank you very much
I always forgot to uncheck reset workflow when I export it.
As usually perfect solution, I ll try to apply it today and upload worflow here
(oh, London miss this city so much )
Have a nice evening with friends
I’ve upload a copy of your flow with some changes. One thing I noticed was that you were grouping days by Employee Name and Day of Month, but that will hit snags when you have more than one month’s data, if that can happen, so I changed it to group by Employee Name and Apply Date.
I added an addition at the bottom that may or may not be useful to you. As things stand, what appears at the end is totals appended to every line. You might find it useful to have these totals displayed only on the final line of the day/week/month groupings for each employee,
I made a component for that a few months ago, and I’ve included it here as a demo.
What this box at the bottom does is create three “group keys” using the same columns used for the earlier groupings. It then runs a component (three times… one for each grouping) that finds the first and last row in each of the groups. It then uses rule engine to clear the value for each row that isn’t the last of the group.
That might be useful. If not just ignore it!
I’m off now. So hope you have a good evening.
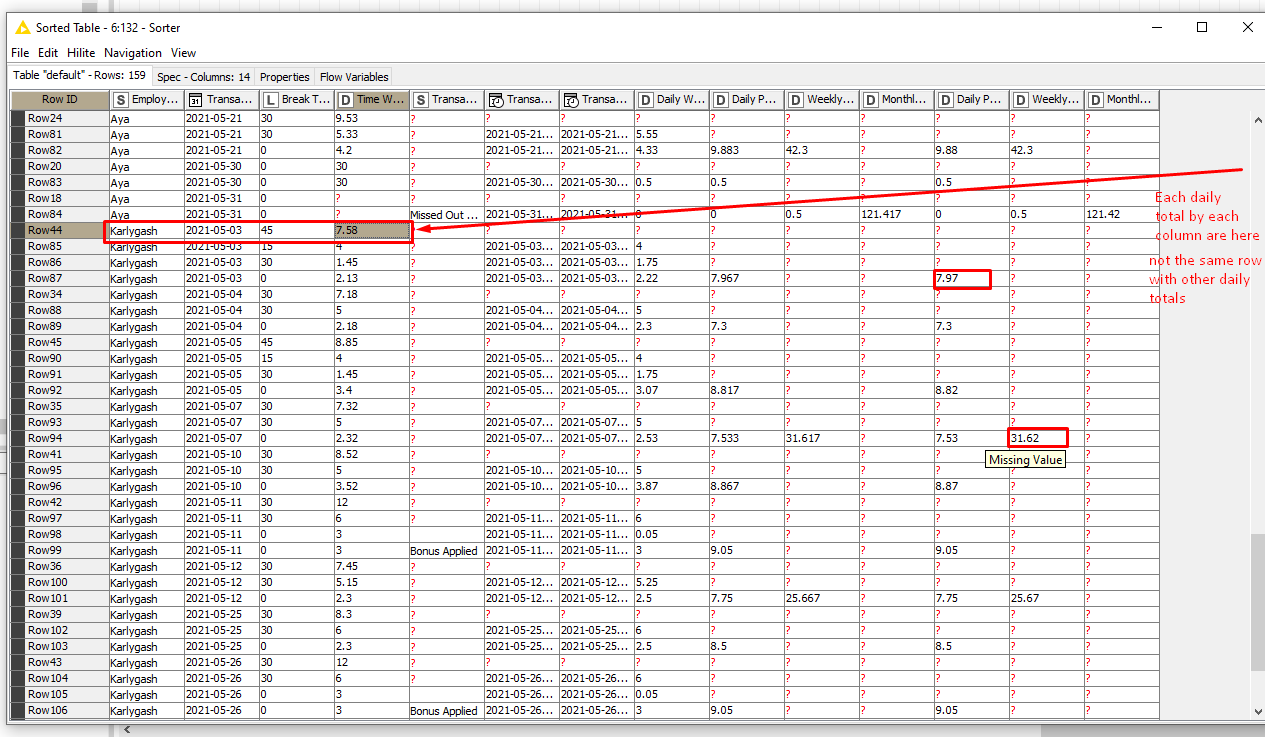
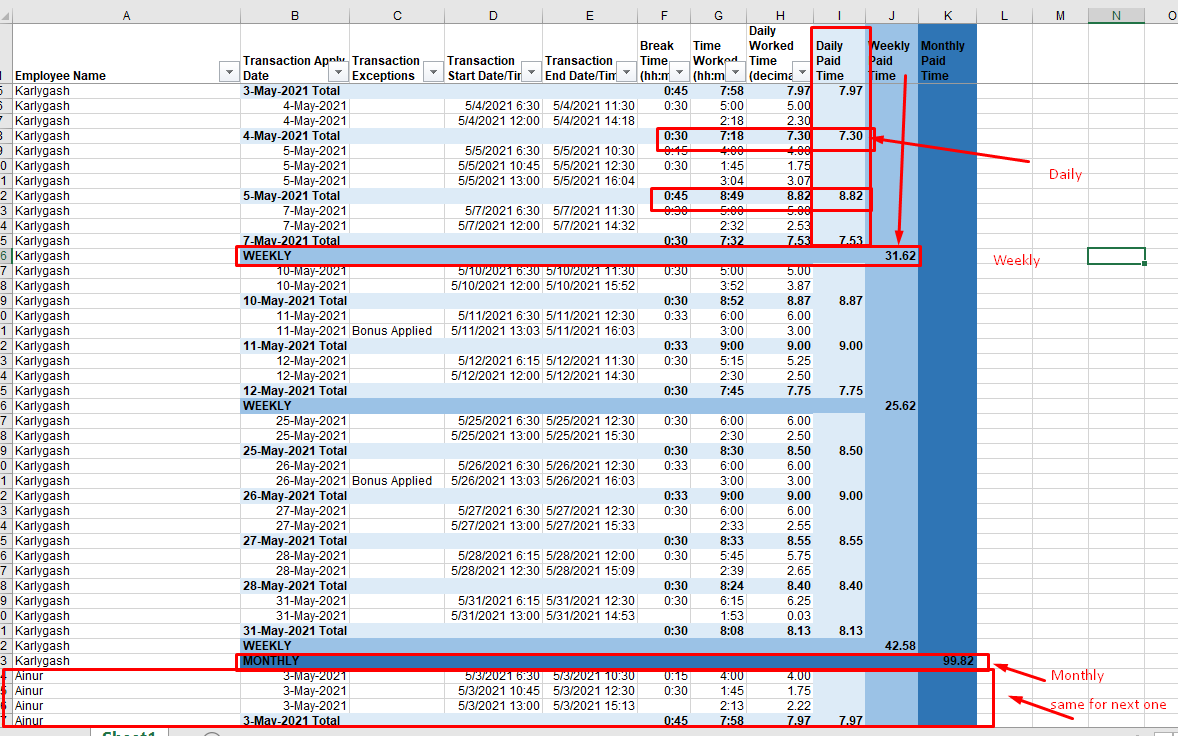
In this sample report, here we have day and total for each column. @takbb you helped me with summing them by daily, weekly and monthly
Here another question is it possible to make them in such view:
4-May-2021 + TOTAL → then their total for each column (Break Time, Time Worked, Daily Worked Time)
The same structure for the other days
Next, new row: Weekly with empty values, but with weekly paid time
and the same for monthly total
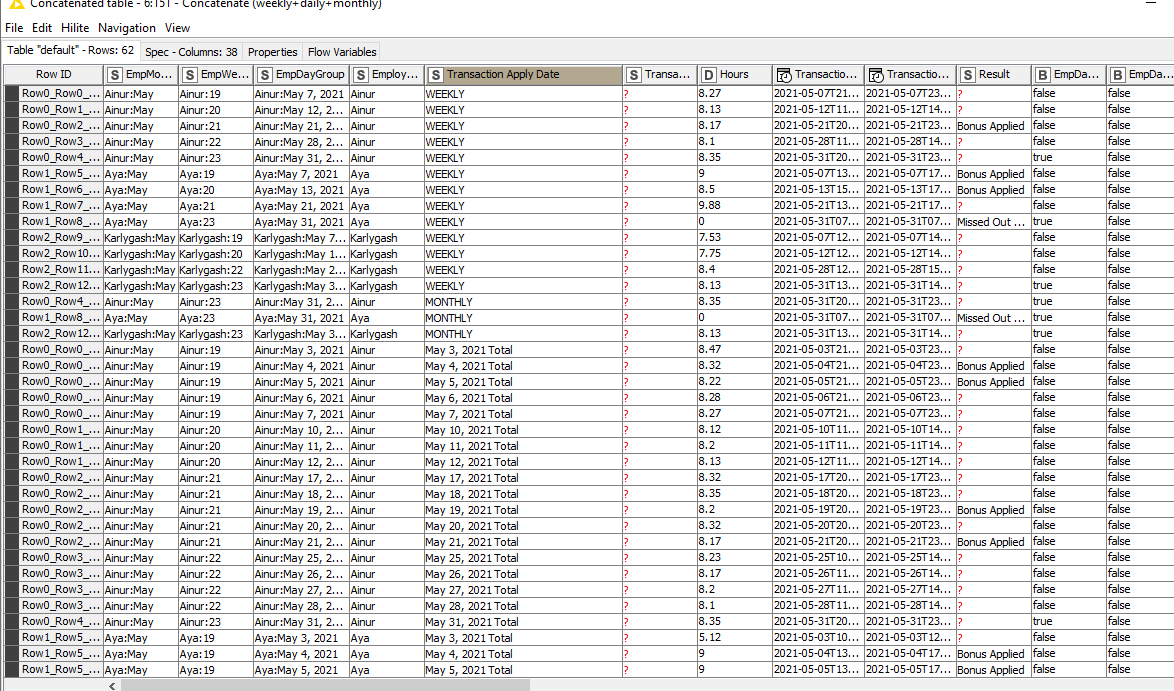
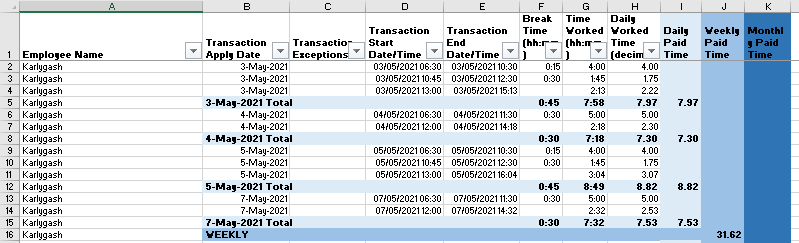
I tried to concatenate values, but I have the following output
In addition, for new row weekly total I used add empty rows, but seems like used it incorrectly
Hope you can help me
Tried to use BIRT reporting, it was really new for me) Did not find proper settings yet
I have uploaded output sample and workflow without resetting =) contingent worker_beta.knwf (814.9 KB) emp_data_out.xlsx (20.6 KB)
No problem at all @Karlygash. I like very much your posts and really enjoy helping you if possible. @takbb has contributed the most to this thread and I believe masters by now much more than me what is now in place. I will be of little help then @takbb will certainly reply soon !
I’ll definitely contribute if at a future step I can be of any help
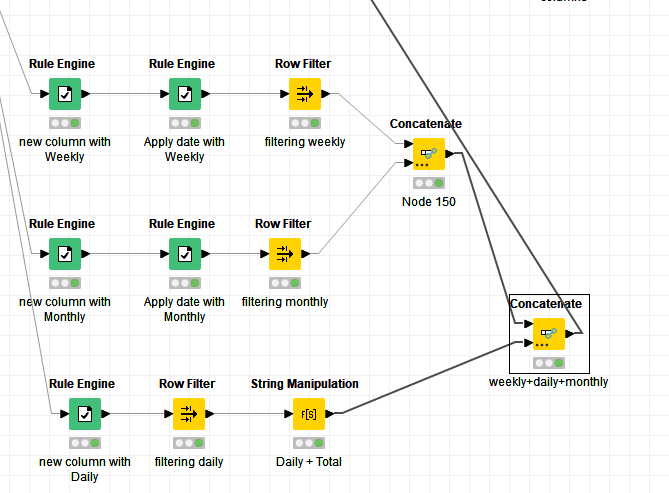
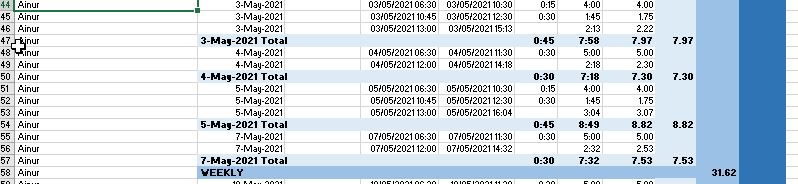
Created new column with value Weekly, Monthly and total and after that I appended it by existing column
The Final step was concatenating them with initial table with total sums
But anyway my result does not look like as a sample
I have reattached my workflow in here contingent worker_beta.knwf (863.0 KB)


 )
) miss this city so much
  )
)