Time Serie´s Stacked Chart + single dates events

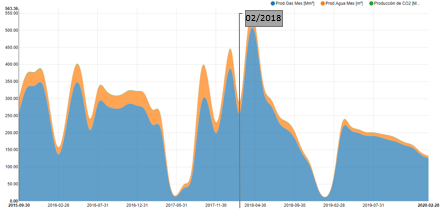
Hi there! I need to analyze a time series chart and I want to superimpose some single date events. I want to have something like the attached file, but I have no clue how to get this. Hope someone can helps, or at least guide me in the right direction. Regards, M.

image

Hi there @MPBotti,

looking for stacked area chart? You can either use “regular” JavaScript Stacked Area Chart or one from Plotly.js library - Stacked Area Chart (Plotly).

Br,
Ivan

Hi,

I will try to do this with Python node … Look at https://stackoverflow.com/questions/11067368/annotate-time-series-plot-in-matplotlib

1 Like

Thanks a lot ipazin…

Thanks a lot andrejz. My knowlege of python is very limited, but I´ll give it a try…

Hi,

To start here is an example on which you can work Stackplot with annotation.knwf (7.6 KB)

3 posts were split to a new topic: “Chrome driver was not initialized” error

Many thanks @andrejz and @ipazin for the help. I´ve updated the db file in order to resemble the one I´m using. btw @andrejz, your workflow is working fine in my workspace. I have no chrome driver error…Stackplot with annotation v2.knwf (12.9 KB)

1 Like

This topic was automatically closed 182 days after the last reply. New replies are no longer allowed.