I have an assignment coming up using KNIME to show the employment and unemployment rate in the UK, the decision tree has been complied with logistic regression.
I would want to keep the data from over 10 years, 2008-2018 and then predict the rate for 2019.
Hi @vickyregi, welcome to the KNIME forum
To have a look at a decision tree example with a binary/classification target you could try this example and swap the data and possibly the algorithm:
For a more extensive discussion about predicting numbers I have recently collected some entries.
Since this is an assignment you might want to think about your own research and contribution into this ![]()
Then one general remark. It is not so easy to predict numbers like unemployment rate or GDP just from a time series since a myriad of factors would play into that - economists and others are constantly struggling to do this.
Cf. also this debate with a example for GDP figures:
Thank you for that.
I would also like to confirm, if I add a confusion matrix as a output I receive as a scorer, my accuracy shows about 95%, I do not think I’m not on the right path.
Not sure what a confusion matrix would do with a regression (numerical) question. Maybe you could post your workflow so we could better understand what it is about.
Supposedly high accuracy numbers always sound good but you might have to put them into the perspective of your business question.
Did you check that workflow on the previous data sets?
I’m not sure whether such a prediction could only be based on historical data. IMHO the main question will be whether that algorithm takes into account all relevant parameters.
Such a parameter could be a twitter from or action by Donald T. (like yesterday).
Or some (to me unknown) effects of the Brexit to the UK economics and thus the employment rate.
Would be great if you can prove me wrong.
You have your point.
But then when I’m trying to train the dataset into logistic regression, I’m not getting the results I’m looking for.
I’m new into data science, this is so confusing.
Business Analytics.knwf (355.5 KB)
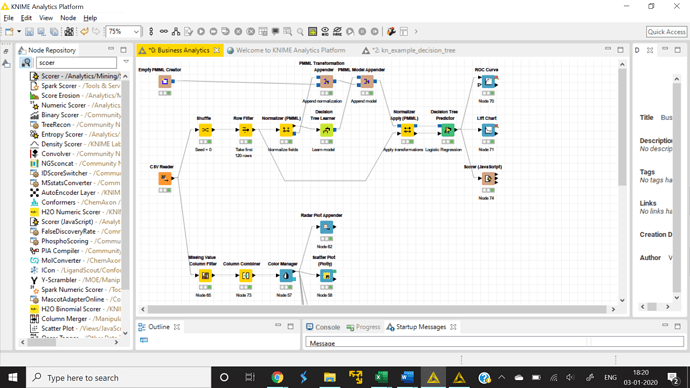
I think I’m doing it wrong, this is my workflow. I want to predict labour statistics data.
It would be really helpful if you could help me.
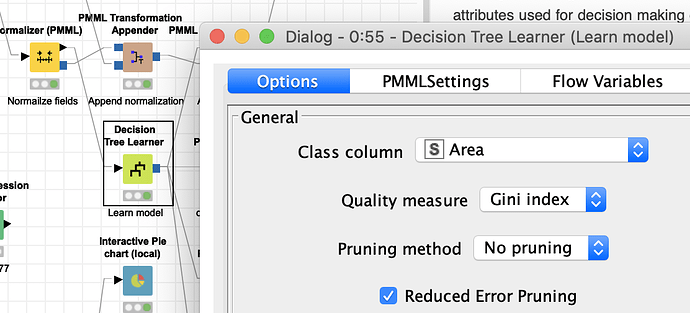
I think you have to take a step back and think about what you want to do and maybe read a thing or two about building predictive models. Your Decision Tree tries to predict the “Area” which is a region in your data, that is if a line is from wales or some other region. Not sure what to make of this.
Thanks so much.
Is there any way I can show the employment and unemployment rate using this workflow?
The labour data with the 4 countries in the UK?
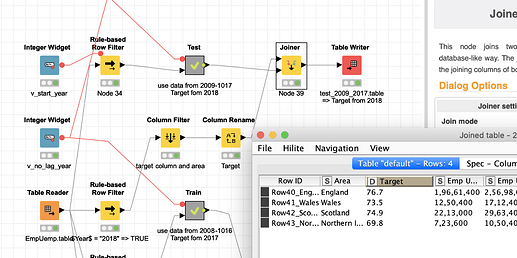
I set up an environment that first transforms you data from 2008-2016 into a table that has the Area (region) as an ID since I understand that is the unit you would want to predict.
The Target is taken from 2017 “Emp UK percent”. If you want Unemployment you would have to change that. The years are transformed into columns, while the first year of the data becomes _0 and the year before that _1 and so on.
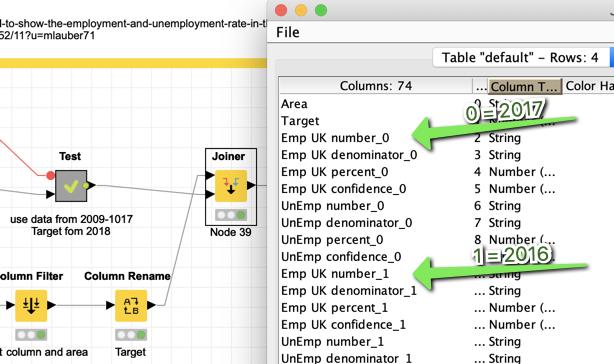
Then I construct a Test dataset using the data of past 9 years from 2009 to 2017 while 2018 provides the Target. So we have the same structure in Train and Test.
Then we use several regression models to predict the Target and see how the model is doing on our test data. Focussing on the RMSE (lowest is best) we see that H2O GLM is best.
Next step would be to use the data from 2010-2018 and do the prediction like it was done on the Test data and you have your prediction for the 4 Areas for 2019.
Of course the question is if such a figure can be derived from just these numbers. But it is there to demonstrate how to do that. Here we use quite complicated algorithms. You might also try just to use a linear model on a time series alone.
And since a figure like unemployment could depend on very many factors I would not bet the farm on having found a magic system to predict unemployment 
Thank you so much, I am going to render the same and put out results.
Can I also add a scorer node which can provide me the accuracy statistics?
The scorer node for numerical targets is already there and provided us with the RMSE statistic to evaluate the model.
You could try to read more about the prediction of numerical targets in this collection of entries:
Also if your assignment is from a university or other educational institution you might want to read the provided literature or ask your professor or tutor which statistic is the preferred/expected one. RMSE is widely used and also often the decisive statistic in Kaggle competitions.
Another note: the models compared in this example are used in their most basic configuration. All the good stuff like normalisation, feature engineering and hyper parameter tuning are not used (yet). But the question is if with so few data points you would get better results.
Also you could legitimately try to predict each area with a time series of its own. But since all parts of the UK are economically connected the model might benefit from having them together in one dataset. And we left the area information there for the model to be used. Another approach could be to leave the area out.
But all this is an addition. You should first concentrate on getting your setting and ‘business question’ right.
thank you so much 
I tried to understand, maybe the approach I’m in is just not right, maybe I have to understand this better.
I thought I could just predict the labor rate with my data set, it is not just rendering.
Not 100% sure what you mean by ‘rendering’. It is possible to make a prediction. I added a workflow that does that and also extended the existing ones slightly:
I also set up an example that just uses the numbers of the previous year and used the last year as test. But the results seem to be worse. You could check it out if you want:
Just out of curiosity I took a look at the current ‘real’ numbers. You have to be careful to interpret them since there are seasonal adjustments and I am not sure what status your original data had (maybe load them again from the original source).
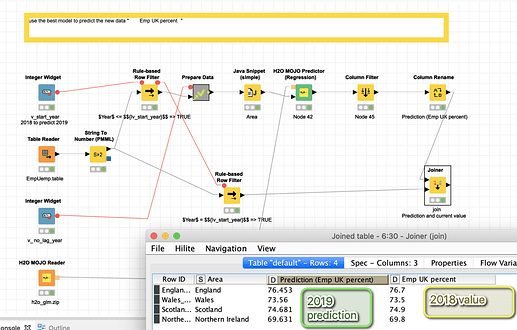
For the 2018 data your numbers of 2018 for Wales and Scotland match, for England and Northern Ireland they are different (cf. Figure 1)
Regional labour market statistics in the UK: October 2019
Table 1: Summary of latest headline estimates for regions of the UK, seasonally adjusted, June to August 2019:
| England | 76.3 |
|---|---|
| Wales | 74.1 |
| Scotland | 74.3 |
| Northern Ireland | 71.5 |
Our model predicted:
| England | 76.453 |
|---|---|
| Wales | 73.56 |
| Scotland | 74.681 |
| Northern Ireland | 69.631 |
In Northern Ireland we were quite far off, something seems to have happened there. The rest one would have to investigate further.
And then again with every prediction, it is the question of how accurate do you have to be. Is a miss of 0.38% points (Scotland) good or bad? What are the consequences of that.
Yes, that is right. the employment rate is almost the same as predicted, is there any way to predict the same with the unemployment rate?
I tried using different algorithms too.
Yes in the data preparation just select the unemployment rate as “Target”.
I added a few algorithms to the build data node.
Please be aware that with such few data points the effect and stability of such models is limited. If you check the feature importance features from 6 years before are prominent. That could mean that there is a cycle of economic development, or it is radom and prune to external influences that are not covered by the data.
Thank you so much 
When I am changing the prediction (target) from employment to unemployment it is still giving me the same results near to the employment statistics, when compared to both shouldn’t the unemployment rate be much lower?
You have to rename the variable to “Target” in the preparation. Maybe you create a new workflow group.
