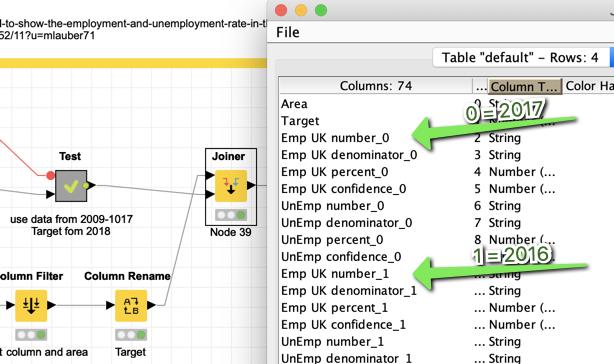
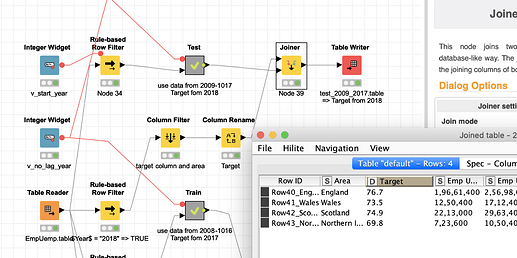
I set up an environment that first transforms you data from 2008-2016 into a table that has the Area (region) as an ID since I understand that is the unit you would want to predict.
The Target is taken from 2017 “Emp UK percent”. If you want Unemployment you would have to change that. The years are transformed into columns, while the first year of the data becomes _0 and the year before that _1 and so on.

Then I construct a Test dataset using the data of past 9 years from 2009 to 2017 while 2018 provides the Target. So we have the same structure in Train and Test.
Then we use several regression models to predict the Target and see how the model is doing on our test data. Focussing on the RMSE (lowest is best) we see that H2O GLM is best.
Next step would be to use the data from 2010-2018 and do the prediction like it was done on the Test data and you have your prediction for the 4 Areas for 2019.
Of course the question is if such a figure can be derived from just these numbers. But it is there to demonstrate how to do that. Here we use quite complicated algorithms. You might also try just to use a linear model on a time series alone.
And since a figure like unemployment could depend on very many factors I would not bet the farm on having found a magic system to predict unemployment 

