Date&Time filter in a plot (both in one component)

Hi,

I want to allow the user to define the time range for which data is plotted in a line plot.

I used the Date&Time widget and the line plot (plotly) in one component for that.

But when I change the beginning or end date nothing changed in the line plot after pressing “apply”.

The line plot has set the “subscribe to filter” to “on”.

What else I have to do?

Best regards
Sabine

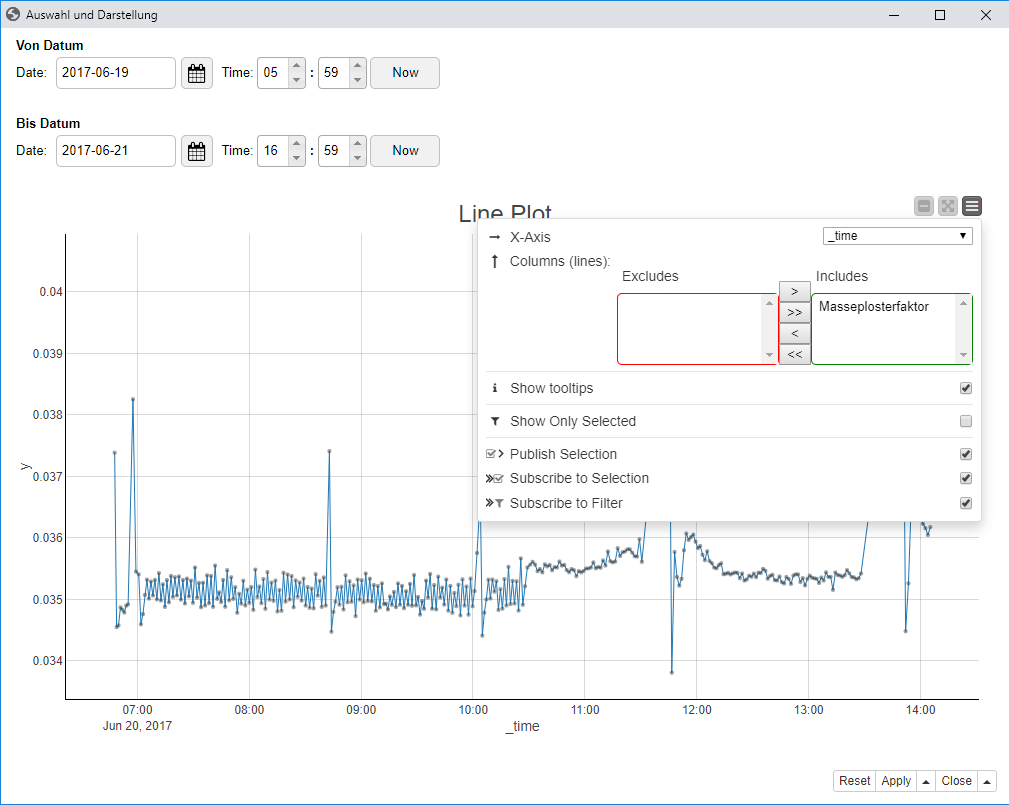
Playing around with Widgets, I notice that some work dynamically (i.e. slider) in the interactive view & interactive value filter, but some don’t seem to (i.e. Column Filter). I think the key is that the interactive versions will change the charts/plot, whereas the non-interactive will not.

Maybe Knime needs to make “interactive” versions of the other widgets as well? :thinking:

I’d love to see the “Apply” button not only put the settings into the workflow, but refresh the view as well.

1 Like

Hi @knimebine007 -

I don’t know what your component currently looks like, but here’s one way to approach it, using a Date&Time-based Row Filter:

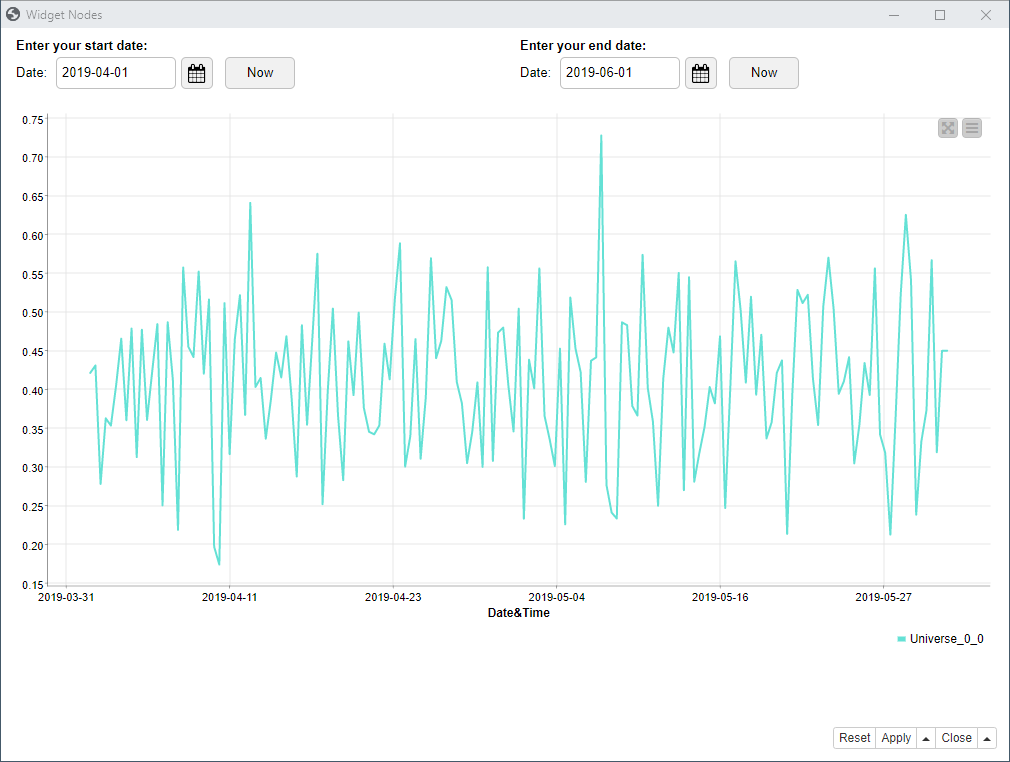
As Evan mentioned, this still doesn’t update dynamically - you have to reopen the view to see the new values applied - but this is something we’re working on. Stay tuned.

2 Likes

This topic was automatically closed 182 days after the last reply. New replies are no longer allowed.