Hello. I’m having trouble adding values to the chart. Could you tell me what steps I need to take to add them? Version 5.8. Thanks in advance for your help.
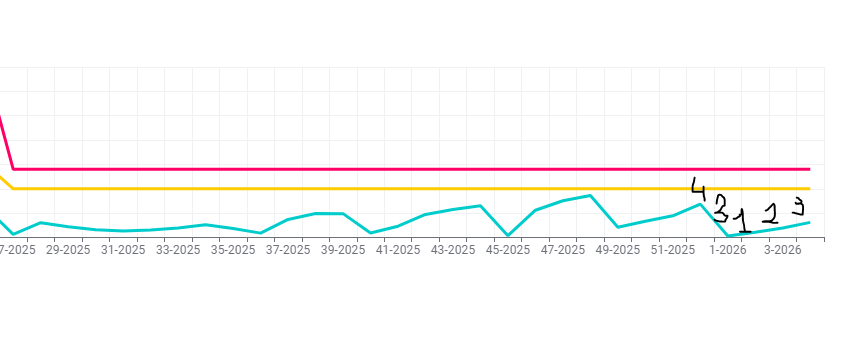
If you’re using the Line Plot node, the values can be displayed in the vertical dimension.
Thanks for the advice, but the values are needed in the graph and not on the axis.
Hello @e207ek,
to my knowledge this is not possible with current Line Plot nodes. Probably there is some ticket buried in ticketing system which needs revisiting @ScottF
Check this topic where user opted for BIRT reporting (legacy reporting):
Br,
Ivan
1 Like
@e207ek my suggestion would be to use a Python (View) node and let an AI write the code specific to your needs. You can use KNIME components to collect the necessary parameters so you can re-use that for further graphics:
”KNIME and Python Graphics — Another Collection of Examples”
2 Likes
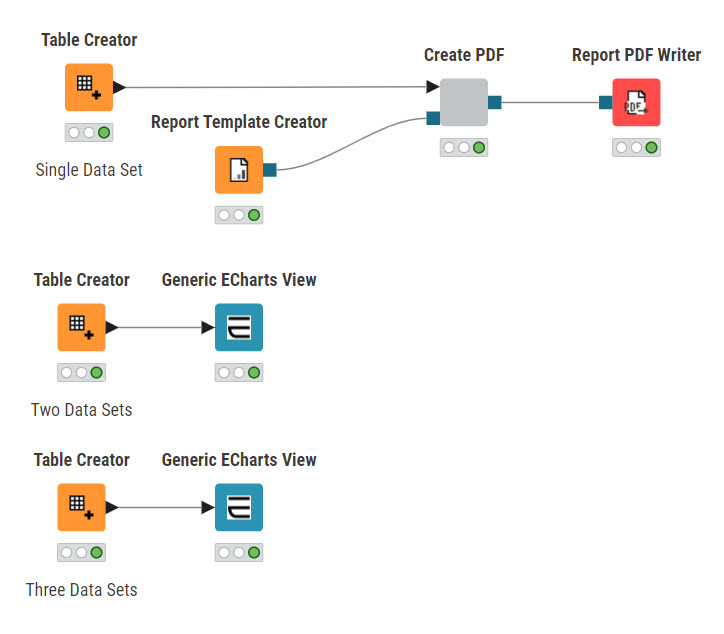
Try this. You can customize as you see fit. The Generic Echarts node is pretty powerful and flexible. Its supported (sometimes imperfectly) by K-AI.
5 Likes
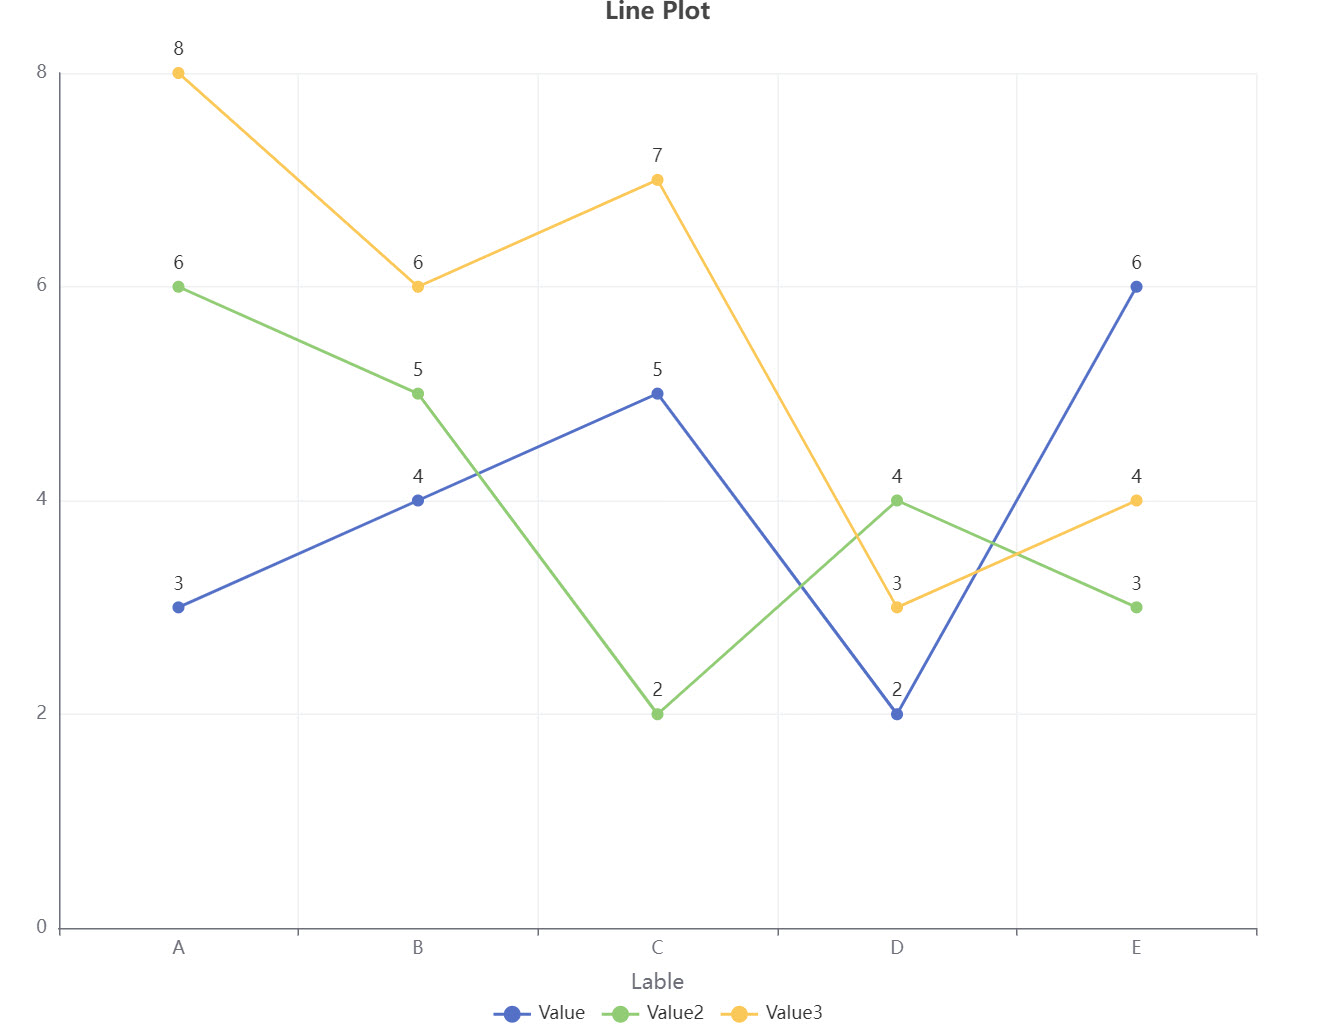
@e207ek I spent some time adding an example of producing a hard copy (PDF) of the output chart. I also added examples of charts with multiple lines.
4 Likes
@e207ek from the PDF you can extract the EChart as a PNG file. Although it is not pretty or standard.
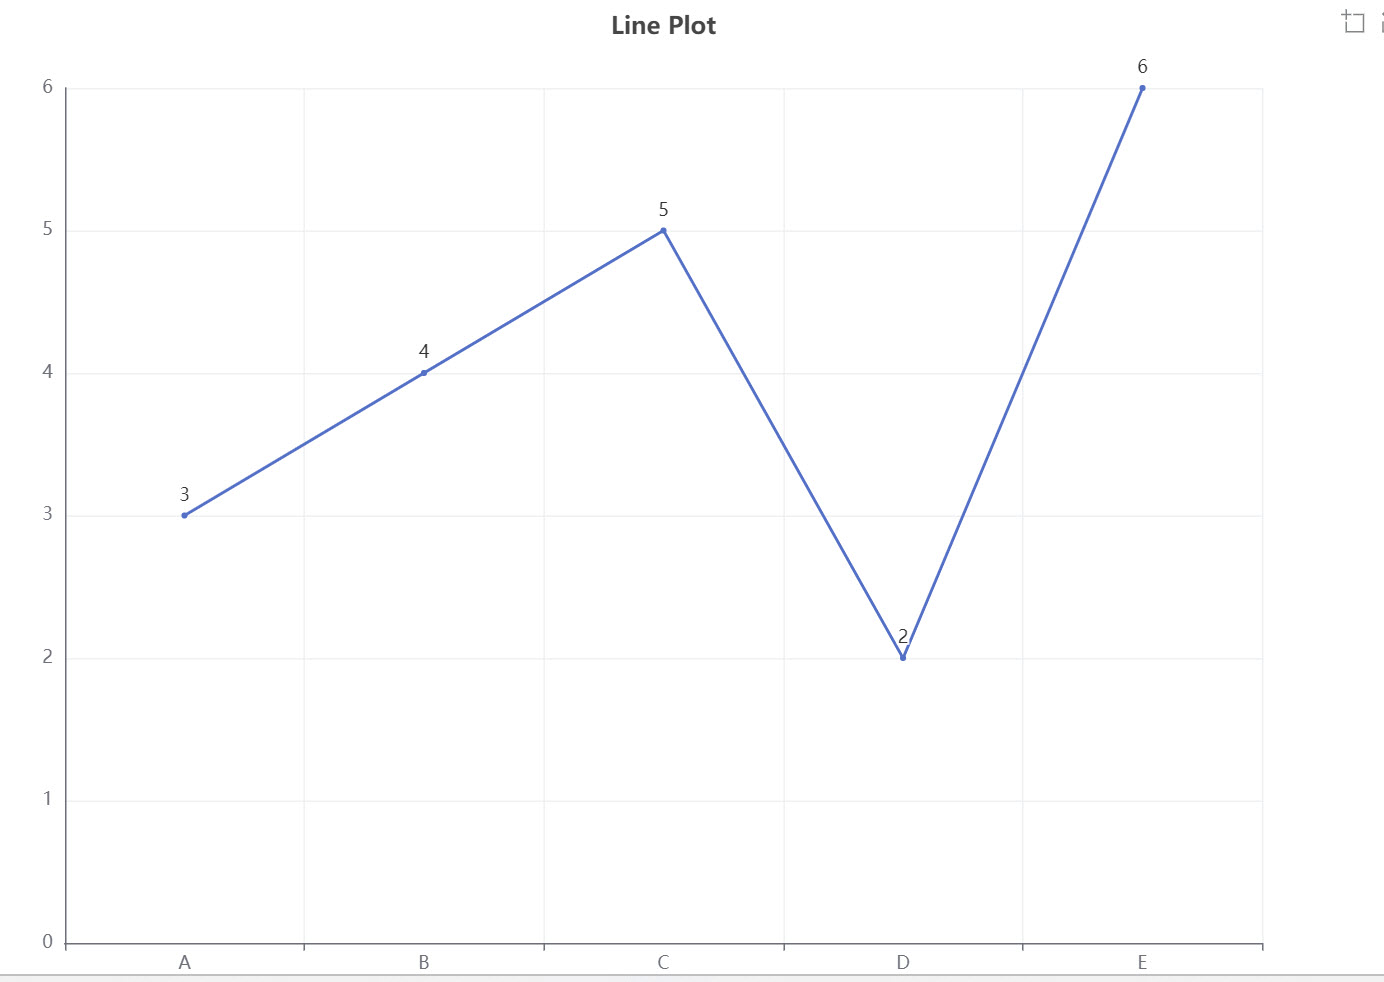
In KNIME 5.8, the Line Plot node doesn’t let you show values directly on the line, only on the axes. To have values on the graph you’d need to use BIRT reporting or export the data to another tool like Python or JS for more control.
Read my posts. The Generic Echarts node works.
Did my workflow(s) address your issue?
I am very grateful for your help, and also thanks to everyone who didn’t stand aside and helped.
Hey! If you’re using the newer versions (like 5.x), the modern Line Plot node actually has a lot more customization in the ‘Visual’ or ‘Format’ settings, but sometimes static labels are still tricky. A quick workaround if you need values visible for a static report is to use the Line Plot (Plotly) node or even the Generic JavaScript View. Plotly tends to be much more flexible with what you can show on the lines themselves.
This topic was automatically closed 7 days after the last reply. New replies are no longer allowed.