I need to forecast Total Agricultural Tractors sales Volumes

Guys,
I need your suggestion about how to go on.
I have 10 years of Total Agricultural Tractors sales Volumes. I have just 10 numbers (full years)
I need to forecast this year.
I thinking to find 10 years variables in internet like (GDP, Commodity prices, Wheater info, Subsidies and so on.
The variables could be:

  • Numerical ones like commodity price, GDP
  • Nominal ones like Weather (dryness, …), Subsidies (YES or NO)

Then based on this year variables forecast I want to find this year Total sales volumes.

How I can do? Regression?

@dariobalmas, welcome to the forum.

There could be several ways to do this. We recently had two discussions about regression predictions with historical data. You could check them out and use the accompanying workflows as an example:

I am try to understand the correlation betweet Target and many variables like this:
Can you help me?

Year Target GDP (current USBiolion$) Agriculture, forestry, and fishing, value added (% of GDP) Exports of goods and services (% of GDP) Imports of goods and services (% of GDP) Cereal production (metric tons) Crop production index (2004-2006 = 100) Cereal yield (kg per hectare) Food production index (2004-2006 = 100) Livestock production index (2004-2006 = 100) Land under cereal production (hectares) Subsidies and other transfers (current LCU) Wheat Crude Oil Beef
1994 2299 139.8 4.214955475 21.47418652 19.29476677 15985688 90.11 2585 82.96 77.89 6184004 57.5 150 46 2
1995 3405 155.5 3.537162821 22.13559863 21.47534006 7514387 73.02 1419.2 70.91 73.38 5294961 10.2 177 45 2
1996 4574 147.6 3.860002427 24.08026334 22.58706515 13670070 95.24 2490.2 85.26 74.71 5489640 102.8 208 31 2
1997 2034 152.6 3.692557569 23.9873307 22.85793118 13254451 94.76 2271.8 85.88 76.55 5834396 107.3 159 43 2
1998 2196 137.8 3.448135515 25.00505476 23.89156288 10232323 88.95 2181.7 80.66 75.05 4690000 117.7 126 70 2
1999 1880 136.6 3.237963805 24.69520924 22.16667685 10059495 95.59 2191.4 86.95 80.28 4590484 123.4 112 62 2
2000 1940 136.4 2.994745986 27.15888005 24.27889391 14549009 102.68 2765.9 95.47 87.93 5260171 136.0 114 62 2
2001 2567 121.5 3.216383213 29.37482794 25.42680549 10714748 93.32 2424.1 88.71 84.74 4420161 150.9 127 67 2
2002 1498 115.5 3.384390416 31.78083655 27.98379975 13048225 102.11 2772.6 96.45 87.66 4706204 174.0 148 83 2
2003 6400 175.3 3.052348605 26.88506116 24.51676993 11819153 99.74 2536.8 96.9 91.23 4659074 201.6 146 117 2
2004 4765 228.6 2.763467723 25.46709621 25.61093793 12026899 100.31 2777.9 98.19 94.33 4329495 234.8 157 142 3
2005 3438 257.8 2.389623573 26.44666415 26.70245124 14175144 106 3309.6 102.85 99.57 4283072 266.8 152 150 3
2006 3193 271.6 2.331412417 29.27389366 31.00337066 9452300 93.69 3141 98.96 106.11 3009317 317.6 192 198 3
2007 6062 299.4 2.643372701 31.17385051 32.50923678 9507863 92.88 2790.3 101.74 112.56 3407418 367.9 255 129 3
2008 5938 286.8 2.859484952 35.62243807 37.24295217 15339478 112.73 4063.2 118.24 122.02 3775240 443.7 326 168 3
2009 2767 295.9 2.713427607 27.91188817 27.50637343 14570877 109.03 4405.5 116.5 123.05 3307450 507.2 224 214 3
2010 3709 375.3 2.387372914 28.61523338 27.37375243 14700931 107.73 4150.4 117.58 127.21 3542031 543.2 224 222 3
2011 3328 416.4 2.285472538 30.46094059 29.65168931 12928365 107.49 4017 116.13 125.24 3218442 618.6 316 222 4
2012 7620 396.3 2.169477737 29.72387936 31.17582008 14556168 112.4 4243.5 119.47 127.76 3430267 676.1 313 205 4
2013 6170 366.8 2.097756311 30.97134112 33.2704187 14154568 116.64 4043 123.17 129.26 3500995 756.9 312 118 4
2014 1919 350.9 2.174706761 31.46864521 32.9658559 16619889 123.42 4896.2 126.7 129.49 3394444 806.5 285 100 5
2015 2275 317.6 2.088751184 30.15288833 31.46418515 11917922 113.43 3531.5 122.05 131.92 3374717 869.4 204 124 5
2016 3938 296.4 2.22405748 30.580928 30.05726005 10187273 104.81 3818.6 116.66 131.1 2667828 908.1 167 157 4
2017 5768 349.6 2.361236373 29.62766937 28.34622556 18905871 5648.2 3347247 979.6 174 144 4
2018 5946 368.3 2.176019651 29.9070826 29.56325111 210 4
2019 3802 202 5

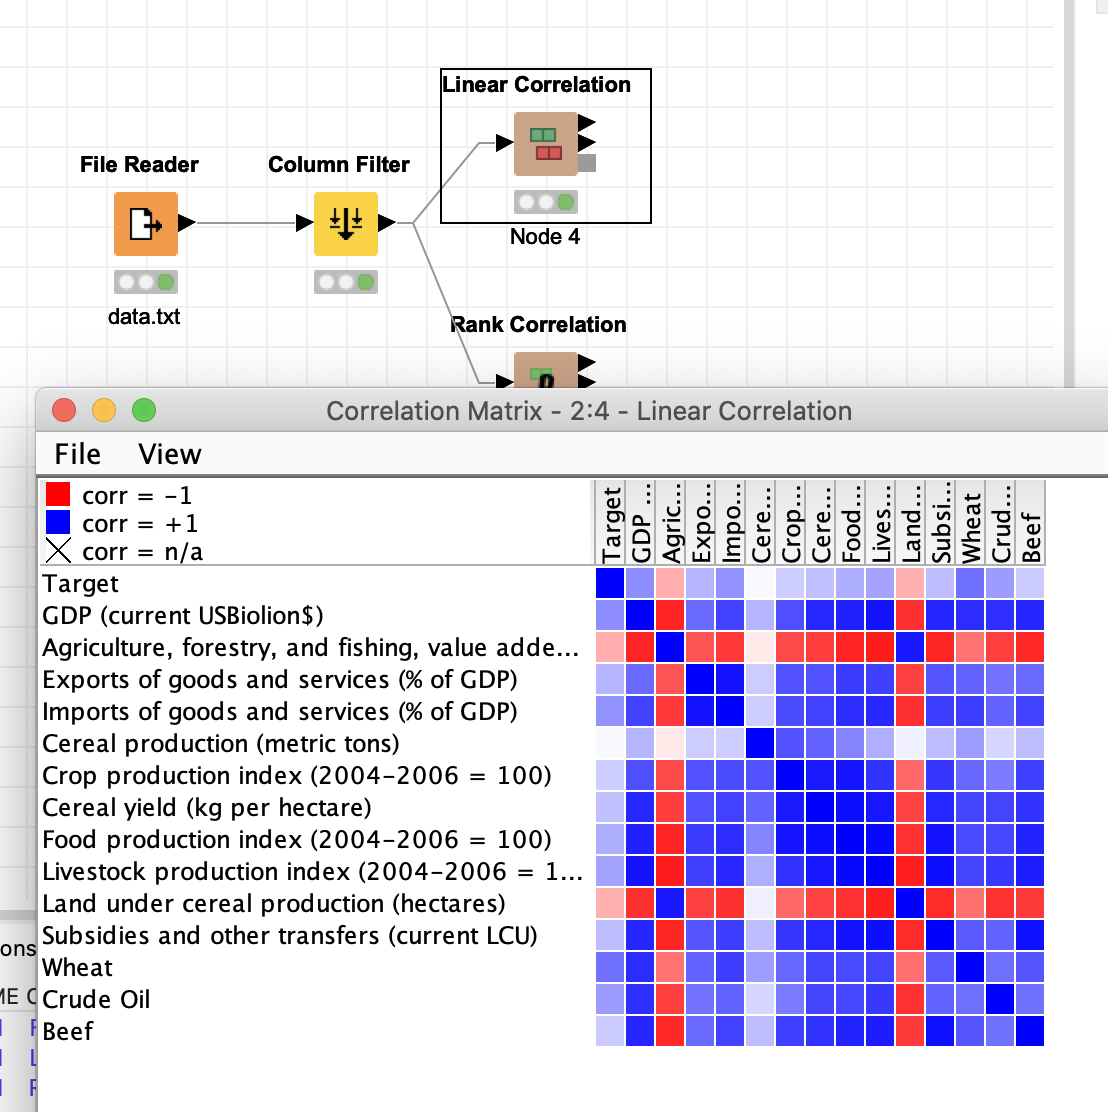
Question is do you want a correlation or a prediction. For correlation there is a node that would give you a matrix, prediction you could follow the last example.

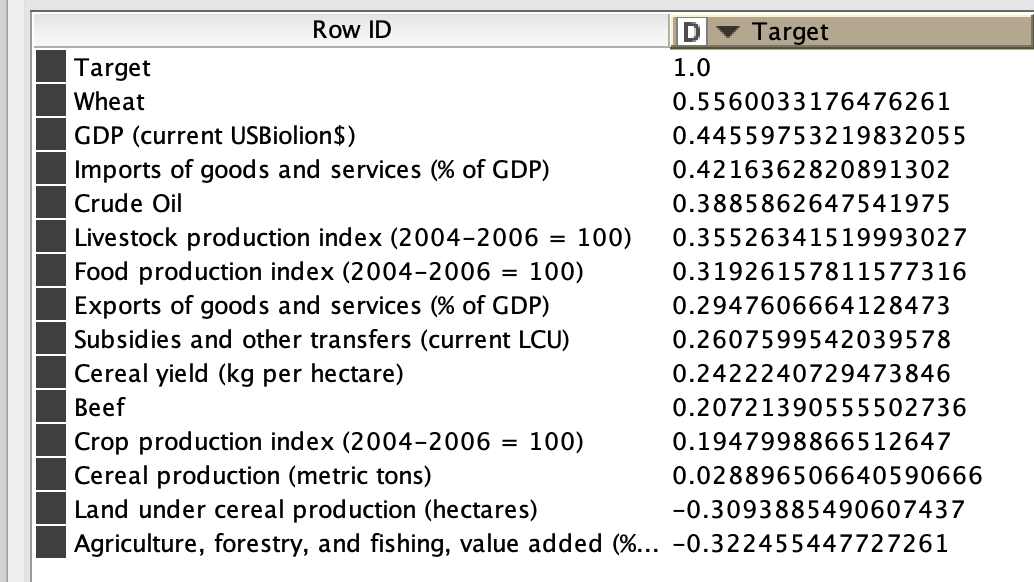
You can see which variables have the strongest correlation with your Target, which would be Wheat, GDP with positive and “Agriculture, forestry, and fishing, value added (% of GDP)” with negative correlation (the larger your target the lower this value).

Great
I would like to predict 2020 value target based on p-value/correlation index of variable like GDP.
I have already 2020 GDP (and other variables…) forecast
Does is make sense?
Thanks
D.

Well you could try to do that. In this example I have used the data from 2015 and 2016 as test and the rest as training. With the model and the data for 2018 you could also predict the target. You just have to be careful what your target means. If it is the sales from 2018 the question would be when would you know the Target and when the other data. So in oder to make an actual prediction you would need the explaining variables before you would need the prediction (Target).

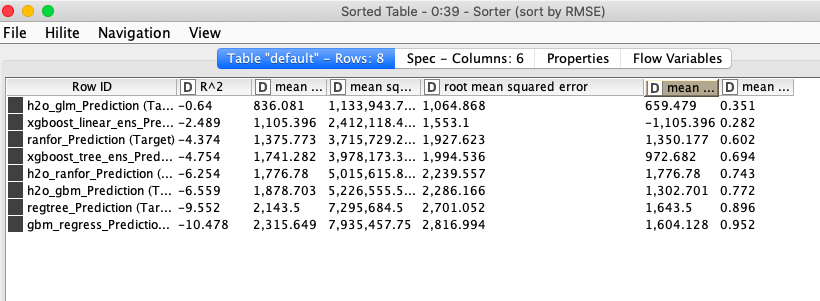
I the example workflow the best model is H2O GLM. Although the prediction for 2015 is not very good.

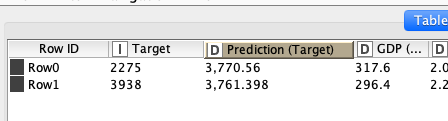
Row0 is 2015 and Row1 is 2016 (H2O omitted the RowIDs). 2016 is OK, 2015 not so much.

image

And as has been mentioned in the other discussions I referenced. With such few data points and a complicated market it is not so easy to make an accurate prediction. Some additional data might help. Or you could eliminate non-standard years (if there is such a thing).

This topic was automatically closed 182 days after the last reply. New replies are no longer allowed.