Hello - please include the feature where we can drop a node on top of a connection between two nodes. That feature is extremely useful!
Thanks.
Hello - please include the feature where we can drop a node on top of a connection between two nodes. That feature is extremely useful!
Thanks.
Defeinitely , With the advancement of acclerated coding learning because of chatGPT … << I recquest you to stop developing “faulty” deep learning integration keras and tensorflow>>
Rather humbly recquest you to make “Python Script” node more seamless within the various context of data sience and deep learning coding.
Because who can not code deep learning, can not implement deep learning, what I believe.
** Just make it more seamless with all other nodes available in Knime**
** I hope knime will be data science hot cake in the market **
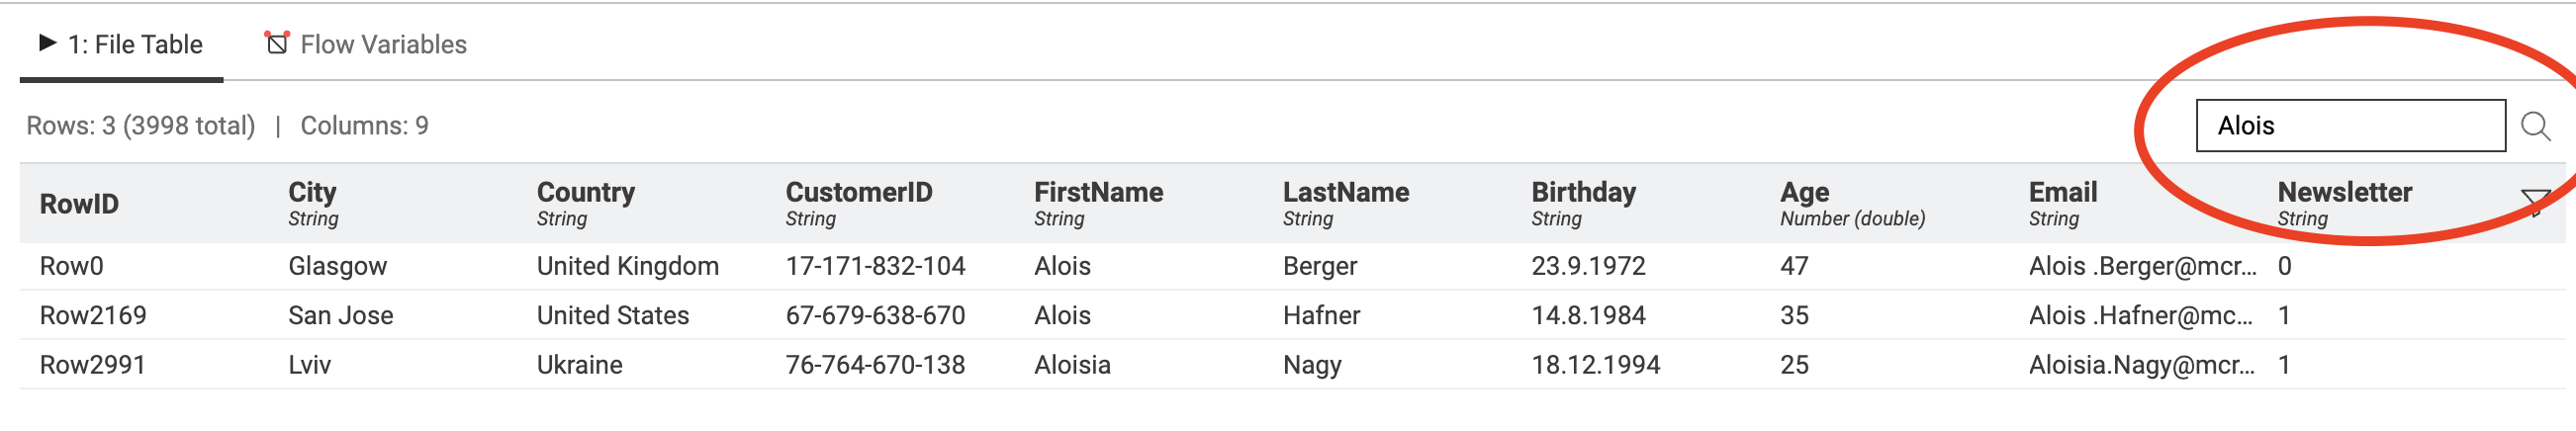
Oh Boy. Boy O’ Boy - can you not search for an item in the node output? Do we HAVE to insert a Row Filter and enter it there???
Please tell me I am doing something wrong!!!
Hi,
You can search for something in the output table using the magnifier icon on the right side of the table view.
Kind regards,
Alexander
phew…what a relief…
Thanks @AlexanderFillbrunn. I just didn’t see it…
Hey @sw1336,
yes, we are currently evaluating different strategies to handle long column names.
Regarding the search and filter buttons we are already working on a solution to fix them to the top right and not to the end of the table. This will make finding them a lot easier.
Greetings,
Daniel
During first start of KNIME5 I selected my regular workspace and it looked like before. No new UI. But Node Repository completely empty.
Confusing…
I closed it and started again. This time selecting a new, empty, workspace and here it is, the new UI.
Thanks for the update @DanielBog!
As mentioned by notsure: The ability to pop out data tables is in my opinion essential. This is because a user spends most of their time on analyzing the output of their tables with the full focus needed, plus it enables a user to compare two data tables and hold the tables next to each other, or switch quickly between them via “Alt + Tabulator” short key ![]()
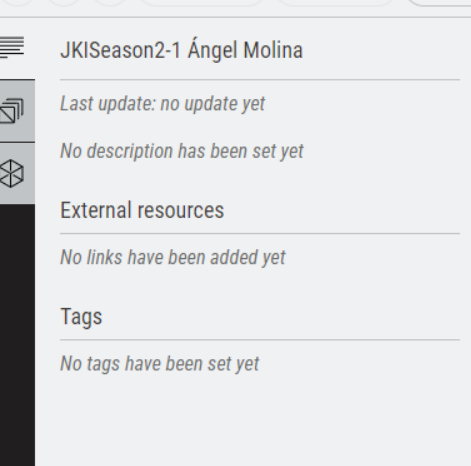
I can’t find a way to tag KNIME 5.
Missing commands in the nodes context menus
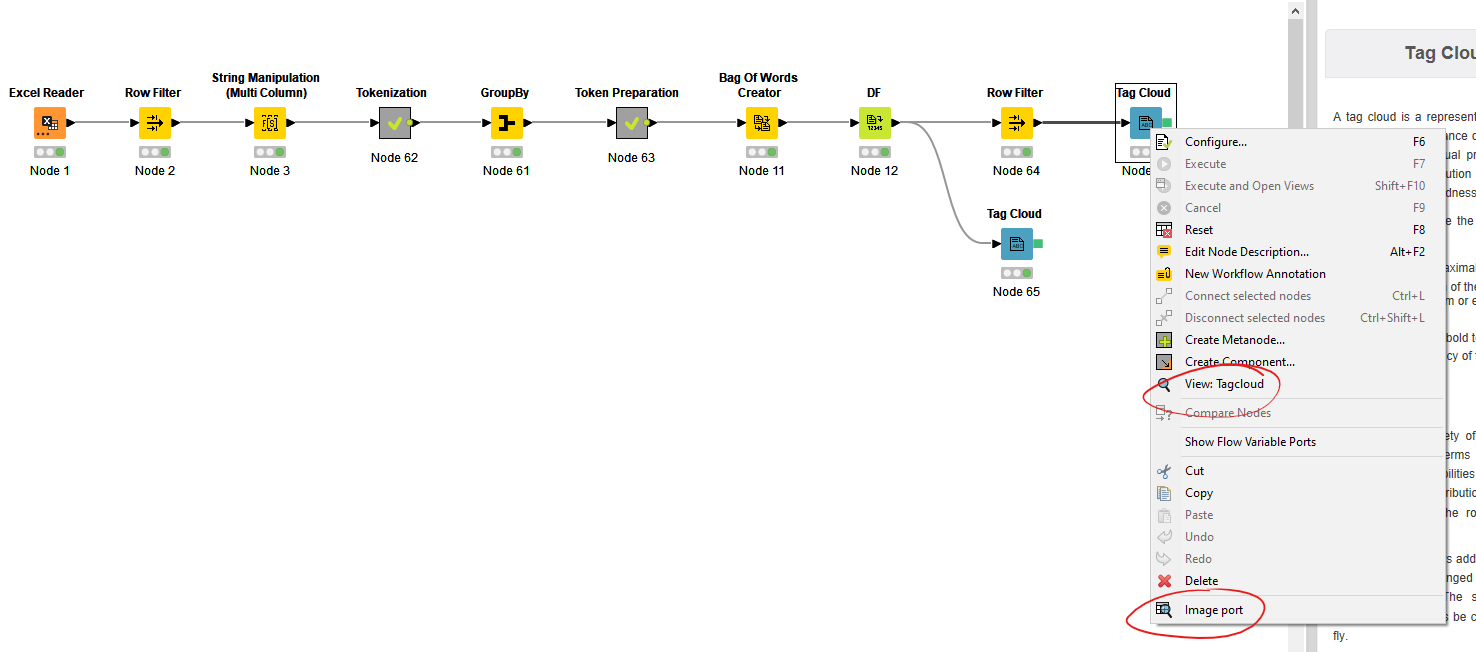
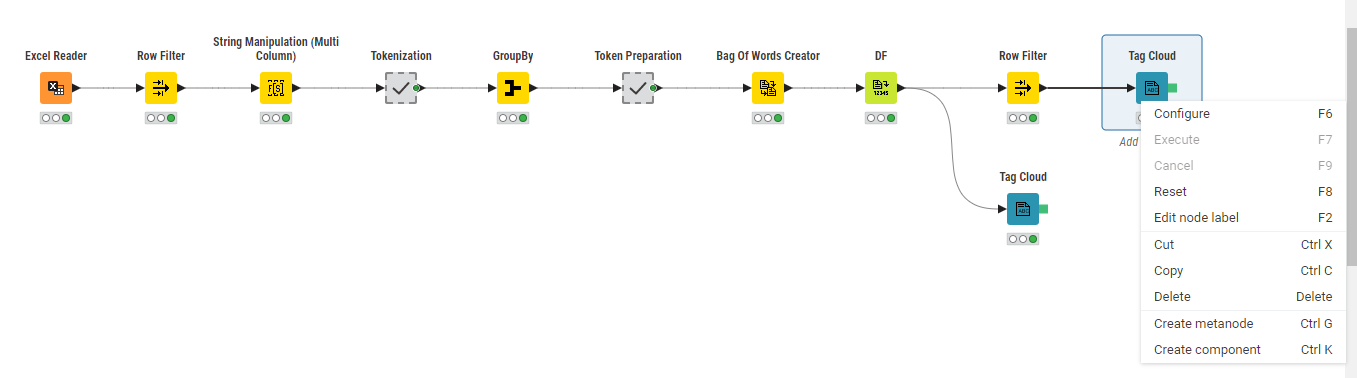
Hi, I’m currently working on a text classification problem. To explore the available data I created a text tokenizer which produces a tag cloud.
Using the new UI I’m missing some important commands in the nodes context menu to display the node output. When the output to be displayed is a table, there is no problem: the lower part of the screen shows the data for each output port; but when it comes to displaying images the user has not enough possibilities to customize the way the image is shown. So I had to revert back to the classic UI.
With the new UI I didn’t find a way to resize or even save the resulting tag cloud as image:
Am I doing something wrong or the feature is actually missing?
Thanks,
Marco
Dear KNIMErs,
In general I really like the new sleek interface and can envision how it helps especially people new to KNIME to get up and running faster. As this is also the type of people I usually teach about KNIME, I can envision that onboarding will be much faster. Also some of the new nodes, will definitely especially care for e. g. “Excel people” → that Value Lookup (or maybe shortened VLookup ![]() ) Node definitely rang a bell
) Node definitely rang a bell ![]()
I am also fully aware that the current version I downloaded (5.0.0 from March 1st) is something like an Alpha version so lots of things are probably still in development. And sometimes it might be just me not finding the right way to do it, but that then is in itself a feedback about User Experience.
With that said, I tried to structure my feedback into three categories:
… and I also tried to provide a reasoning for my comments which hopefully makes it more understandable for devs and readers.
Oh, and I liked the previous feedbacks from other KNIME users assuming that posts with a lot of hearts are considered as an upvote for those post / topics.
Let’s go …
Issues
Suggestions
I have only one (so far): the same search functionality as in the Node Repository would be great in the new “popup workflow coach” - that would massively speed up workflow creation.
What I like
Hope this helps
Nice @kowisoft ! When someone asks Phillip for detailed feedback at Summit, they get detailed feedback ![]()
Hi all, some notes on the first impression about v5.
What I definitely like the most is the new output window. Every time when I inspected the results of an executed node - and this is for sure the most wanted action on an executed node, to inspect the results - the popup window was in the way. Now without any effort, I will always get the output presented.
Some drawbacks I discovered:
I would think that these issues are not principle design problems but some detail problems to get old functionality into the new design.
Question: Is there an update of the API for node developers?
I’m excited about the final 5.0 to come!
The new interface is a step backward from a professional user’s point of view.
The ability to focus on the workflow and calculations in the nodes, rather than on a constantly updating data table as in Excel, is something that made KNIME a tool for serious computation, modeling, and data science.
When working with large workflows, the large data window over the whole display is annoying; on the contrary, the ability to view the data tables at different nodes is missing.
As a user of KNIME for more than ten years, I humbly recommend focusing on solving some chronic problems of the platform, rather than adding new half-baked features and breaking what works.
As an example, I would mention solving charting as a chronic problem. KNIME has about four or five different tools to plot graphs, but none that are of good quality and usable for creating professional and customizable graphs that can be exported and used in reports or publications. The new interactive graphs look cool, but they’re not useful for serious work. Instead of adding such a new tool, it would be better to fine-tune the usability of some of the existing ones. Or better yet, give up developing a new tool and create a user-friendly interface for one of the classic libraries, e.g. Matplotlib, since Python is already embedded in KNIME.
This would save a lot of time for the user because now quality graphs have to be created with external tools - I do it with Python, for example. Yes, it can be done, but it lacks the elegance that a tool like KNIME could bring to users so their energy can be spent on data analysis rather than on needed knowledge of code syntax when they need more than a basic plot.
Serious general request - please, for version 5 and beyond, keep the option to switch to the classic view - just as there is now an option to switch to the new UI.
Thanks!
As you have started the tabbed window in knime, you can implement tableau or power bi visuals in knime tab, keeping the tableau or power bi in the backend. All tabbed windows should support some of interactive reporting option and exporting of the reports for dash and plotly.
There should be other features to be incorposated like PMML etc more learning transfer even for deep learning transfer, so tha ML engineer can work with the transfer. So that we can contribute in the wide range ML engineering section directly.
Data I/O should be more automated, it now recquire more manipulation steps then other softwares. Sometime it recquires advanced programming within knime. Even excel can handle those I/O automatically, but Knime can not detect without appropriate coding.
A little bit off topic. One option could be to pre-configure Phyton based graphics so a user would have some flexibility but also a basic framework without too much code.
A list of the (too?) many graphic options and packages is at the end of the article
I just reinstalled 4.7.3. It came with an embedded V. 5. I previously installed V.5 on its own and created a workplace for it. When I open the new version, there’s no way I can see to open my V.5 workplace.
A post was split to a new topic: Version 45 Python Trouble on Mac
Hey @jakub,
thank you for your feedback. I can only focus on the visualisation part. When you are saying “you like the new interactive graphs” are you referring to the JavaScript views we have for several years already, or are you referring to the new (labs) views? If it is about the new (labs) views I am more than happy to hear your feedback on why you think they are not useful for serious work. If it is not about them please feel free to check them out and give us feedback.
There is a dedicated forum thread only for the new views and I am more than happy to discuss missing functionality or bugs.
Greetings,
Daniel