Knime Quits Unexpectedly when running from Eclipse Mac OS X Catalina

Hi Knime Community,

I am very new to Knime, and I currently have a software development project related to the Knime software. To start things off, I attempted to run Knime from eclipse.

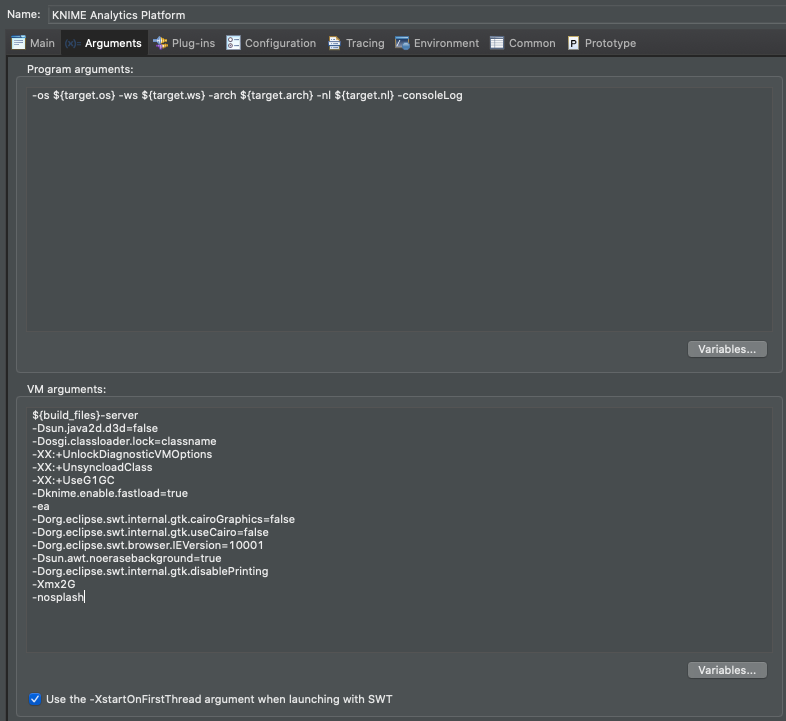
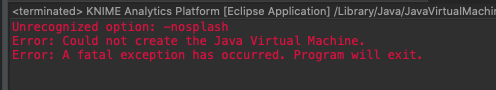
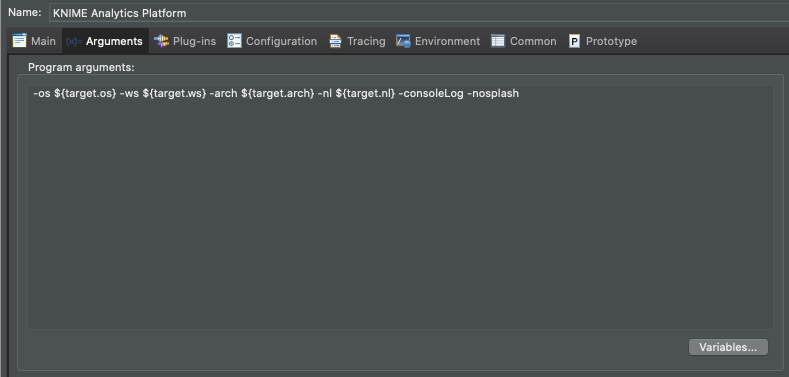
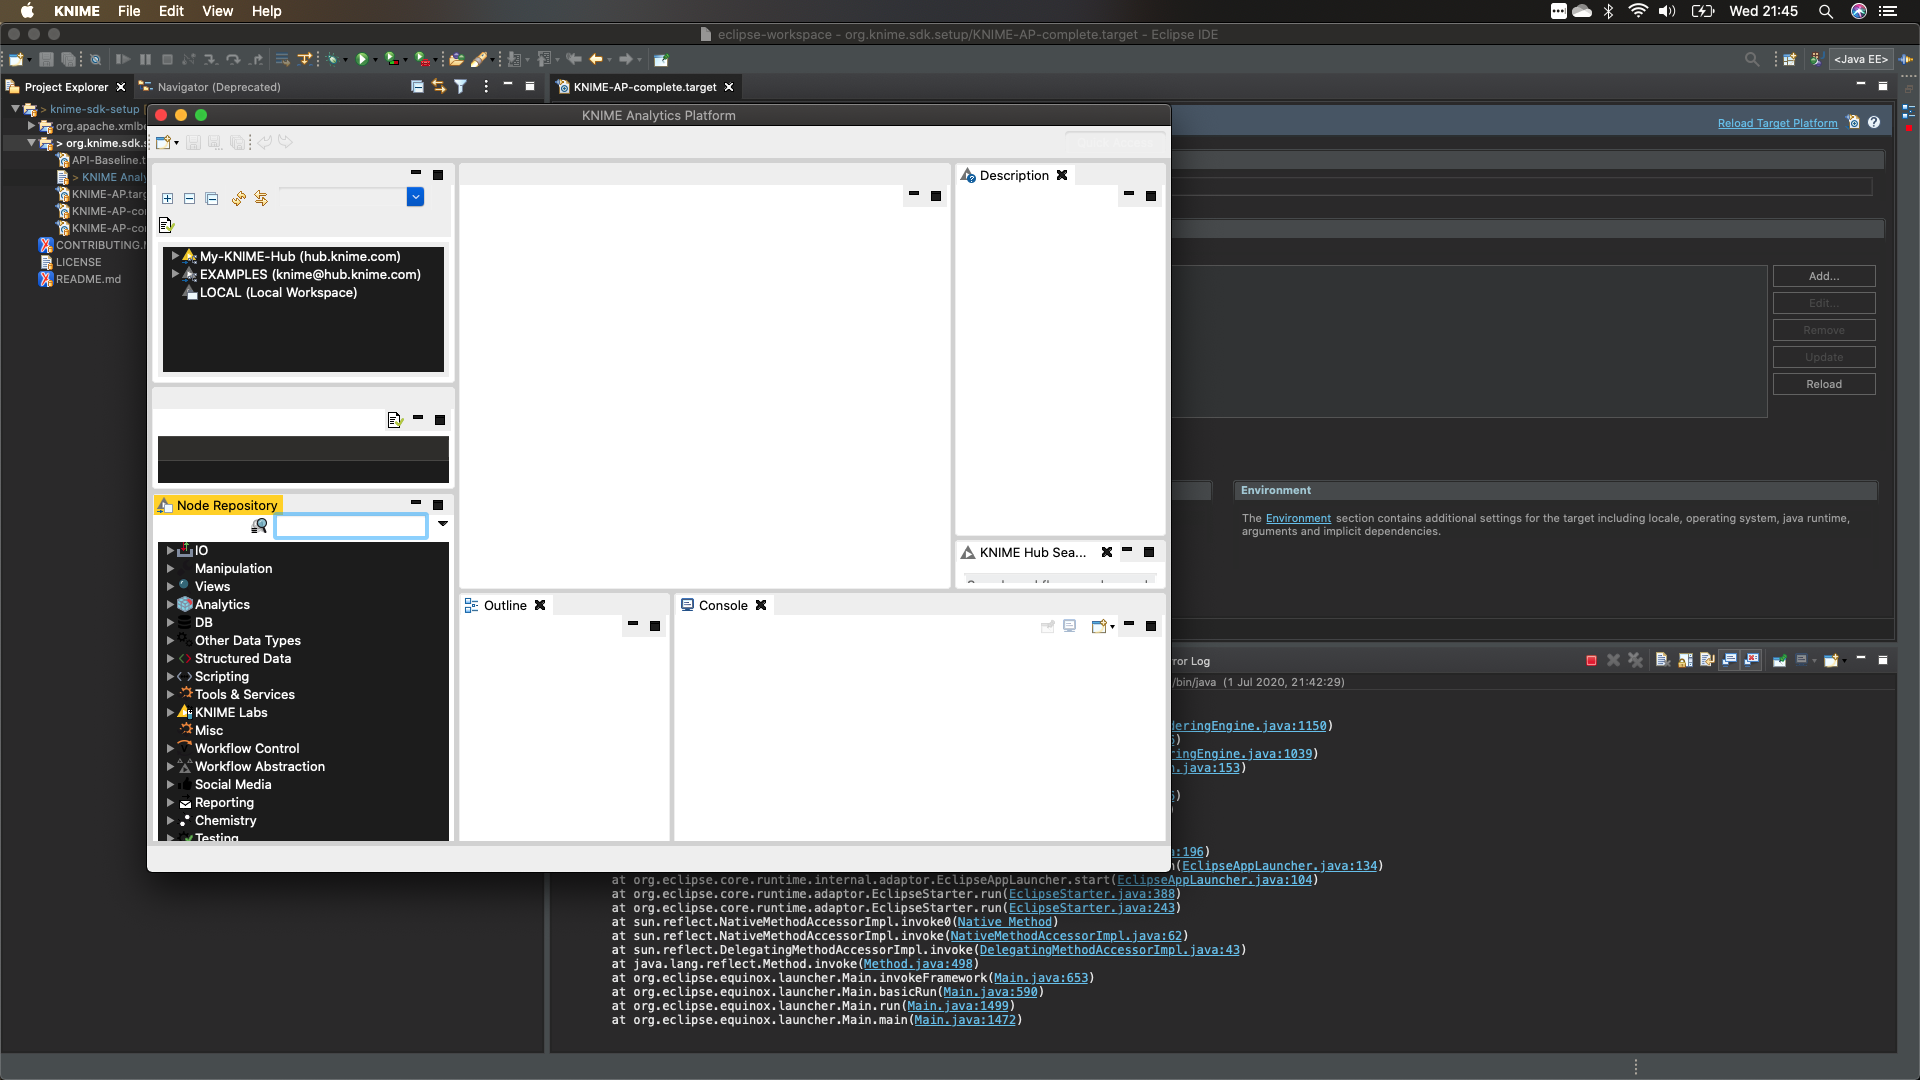
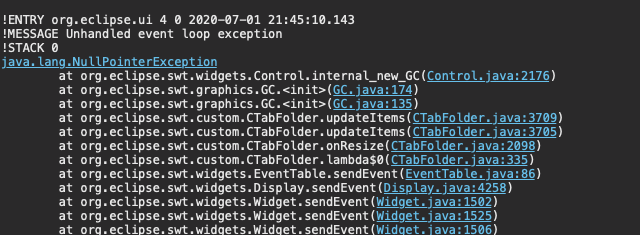
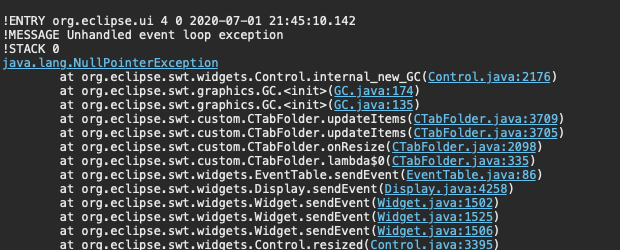
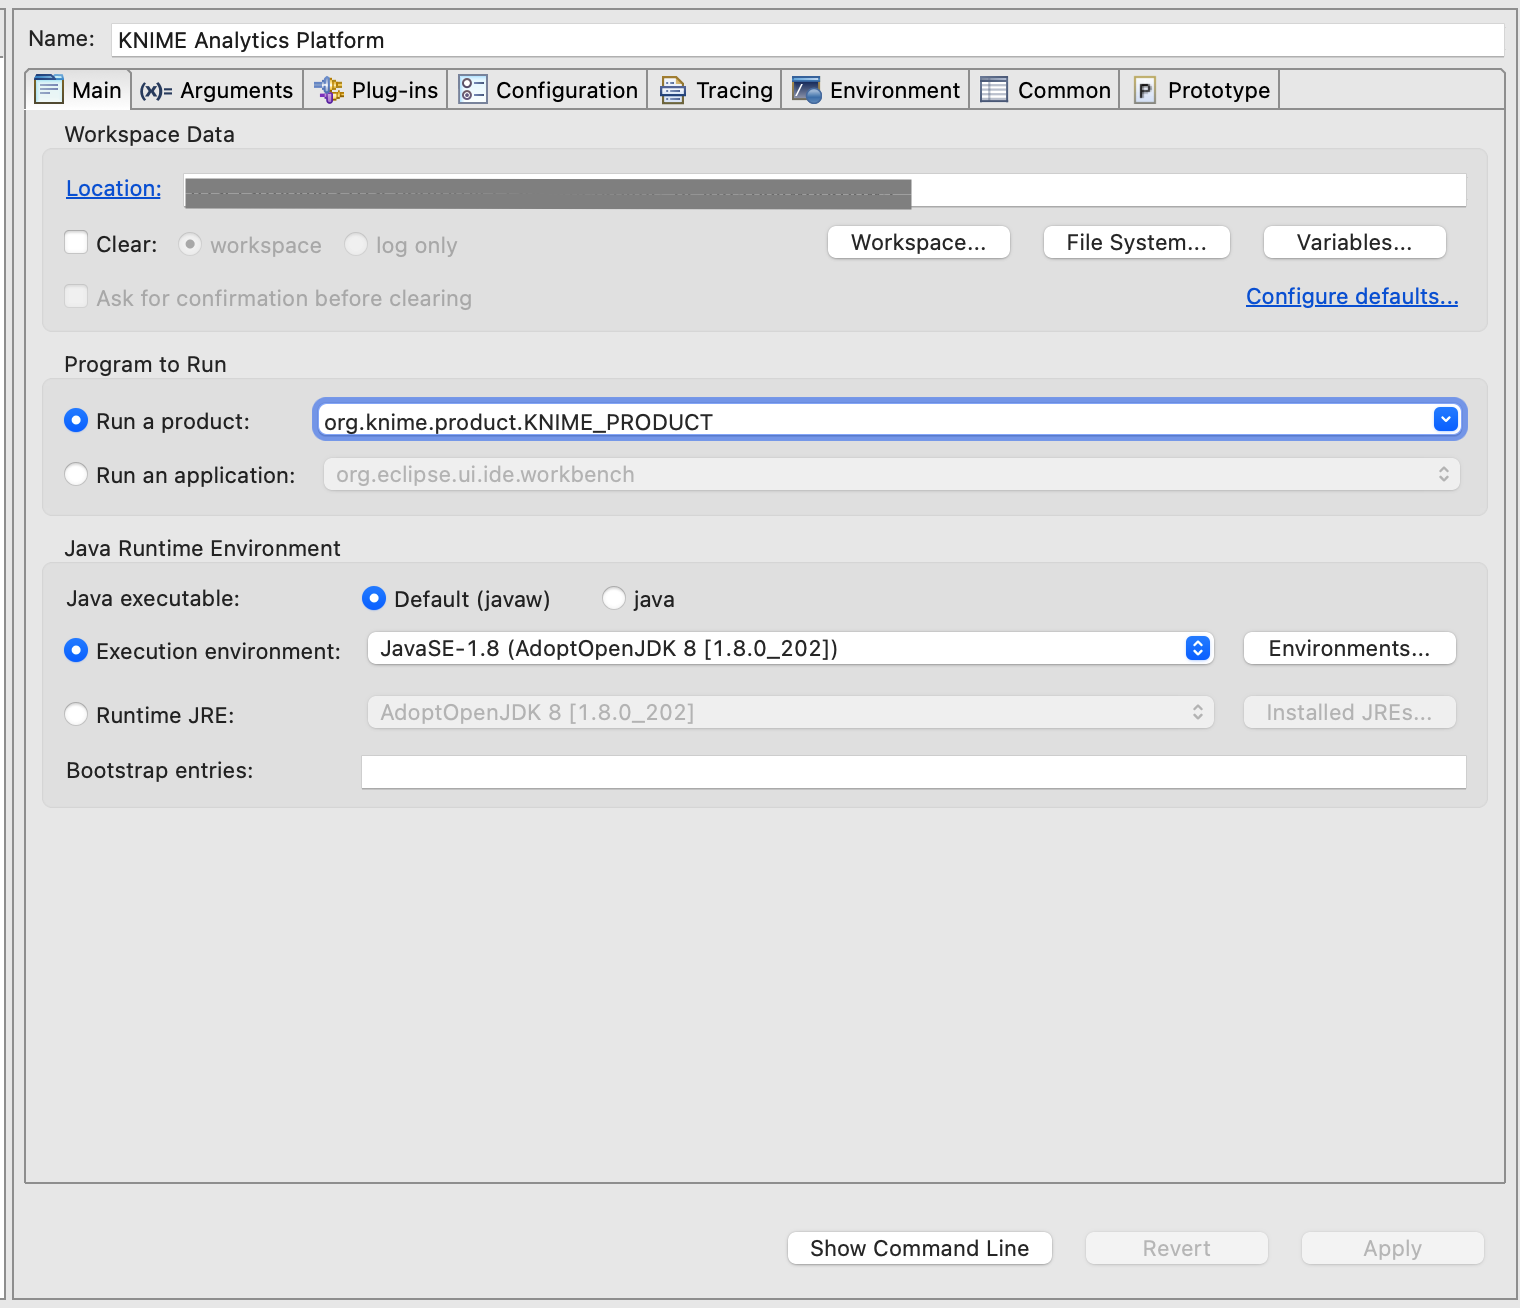
I followed the instructions from here: Github SDK Setup for the setup. Everything looks okay but when I ran the app, the Knime splash screen appears, but soon after that it crashes, saying that “Knime quits unexpectedly”.

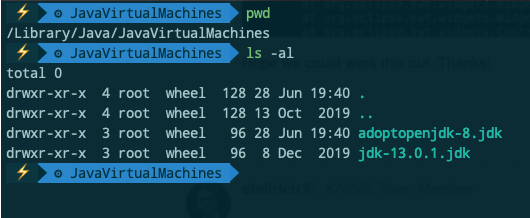
I am running Eclipse for RCP and RAP on MacOS Catalina. I have Java 13 installed, but followed the instructions from here to install and setup OpenJDK 8 on eclipse.

Upon crashing, the problem report showed:

Process:               java [7074]
Path:                  /Library/Java/JavaVirtualMachines/adoptopenjdk-8.jdk/Contents/Home/bin/java
Identifier:            java
Version:               1.0 (1.0)
Code Type:             X86-64 (Native)
Parent Process:        eclipse [6985]
Responsible:           eclipse [6985]
User ID:               501

Date/Time:             2020-06-29 20:50:03.874 +0100
OS Version:            Mac OS X 10.15.5 (19F101)
Report Version:        12
Bridge OS Version:     4.5 (17P5300)
Anonymous UUID:        F65265FB-B9C5-80D1-35DF-78C0319069D8

Sleep/Wake UUID:       5132C329-5BB6-4873-92FD-73DD2955982A

Time Awake Since Boot: 22000 seconds
Time Since Wake:       4500 seconds

System Integrity Protection: enabled

Crashed Thread:        0  Dispatch queue: com.apple.main-thread

Exception Type:        EXC_BAD_ACCESS (SIGABRT)
Exception Codes:       KERN_INVALID_ADDRESS at 0x0000000000000000
Exception Note:        EXC_CORPSE_NOTIFY

VM Regions Near 0:
--> 
    __TEXT                 00000001052a3000-00000001052af000 [   48K] r-x/rwx SM=COW  /Library/Java/JavaVirtualMachines/adoptopenjdk-8.jdk/Contents/Home/bin/java

Application Specific Information:
abort() called

Thread 0 Crashed:: Dispatch queue: com.apple.main-thread
0   libsystem_kernel.dylib        	0x00007fff6e50d33a __pthread_kill + 10
1   libsystem_pthread.dylib       	0x00007fff6e5c9e60 pthread_kill + 430
2   libsystem_c.dylib             	0x00007fff6e494808 abort + 120
3   libjvm.dylib                  	0x0000000106857d2e os::abort(bool) + 22
4   libjvm.dylib                  	0x000000010695f0b2 VMError::report_and_die() + 2148
5   libjvm.dylib                  	0x000000010685c25c JVM_handle_bsd_signal + 529
6   libjvm.dylib                  	0x0000000106859c2c signalHandler(int, __siginfo*, void*) + 45
7   libsystem_platform.dylib      	0x00007fff6e5be5fd _sigtramp + 29
8   libjvm.dylib                  	0x000000010690c6fa AbstractInterpreter::can_be_compiled(methodHandle) + 90
9   com.apple.Foundation          	0x00007fff36a70db3 _NSSetObjectValueAndNotify + 81
10  libswt-pi-cocoa-4763.jnilib   	0x00000001235645b5 Java_org_eclipse_swt_internal_cocoa_OS_objc_1msgSend__JJJ + 53
11  ???                           	0x000000010749d5a7 0 + 4417246631
12  ???                           	0x000000010748cb10 0 + 4417178384
13  ???                           	0x000000010748cffd 0 + 4417179645
14  ???                           	0x000000010748cffd 0 + 4417179645
15  ???                           	0x000000010748cffd 0 + 4417179645
16  ???                           	0x000000010748cffd 0 + 4417179645
17  ???                           	0x000000010748cffd 0 + 4417179645
18  ???                           	0x000000010748cd80 0 + 4417179008
19  ???                           	0x000000010748cd80 0 + 4417179008
20  ???                           	0x000000010748cd80 0 + 4417179008
21  ???                           	0x000000010748ce54 0 + 4417179220
22  ???                           	0x000000010748ce54 0 + 4417179220
23  ???                           	0x000000010748cd80 0 + 4417179008
24  ???                           	0x000000010748cd80 0 + 4417179008
25  ???                           	0x000000010748cd80 0 + 4417179008
26  ???                           	0x00000001074854e7 0 + 4417148135
27  libjvm.dylib                  	0x00000001066c232f JavaCalls::call_helper(JavaValue*, methodHandle*, JavaCallArguments*, Thread*) + 1681
28  libjvm.dylib                  	0x00000001068a0995 Reflection::invoke(instanceKlassHandle, methodHandle, Handle, bool, objArrayHandle, BasicType, objArrayHandle, bool, Thread*) + 1885
29  libjvm.dylib                  	0x00000001068a154e Reflection::invoke_method(oopDesc*, Handle, objArrayHandle, Thread*) + 394
30  libjvm.dylib                  	0x0000000106716417 JVM_InvokeMethod + 528
31  ???                           	0x000000010749d5a7 0 + 4417246631
32  ???                           	0x000000010748cd80 0 + 4417179008
33  ???                           	0x000000010748cd80 0 + 4417179008
34  ???                           	0x000000010748ce54 0 + 4417179220
35  ???                           	0x000000010748cd80 0 + 4417179008
36  ???                           	0x000000010748cffd 0 + 4417179645
37  ???                           	0x000000010748cffd 0 + 4417179645
38  ???                           	0x000000010748ca40 0 + 4417178176
39  ???                           	0x00000001074854e7 0 + 4417148135
40  libjvm.dylib                  	0x00000001066c232f JavaCalls::call_helper(JavaValue*, methodHandle*, JavaCallArguments*, Thread*) + 1681
41  libjvm.dylib                  	0x00000001066d62d3 jni_invoke_static(JNIEnv_*, JavaValue*, _jobject*, JNICallType, _jmethodID*, JNI_ArgumentPusher*, Thread*) + 584
42  libjvm.dylib                  	0x00000001066d9952 jni_CallStaticVoidMethod + 503
43  java                          	0x00000001052a5daa JavaMain + 2527
44  java                          	0x00000001052a8905 __JVMInit_block_invoke + 75
45  com.apple.Foundation          	0x00007fff36a42ac5 __NSBLOCKOPERATION_IS_CALLING_OUT_TO_A_BLOCK__ + 7
46  com.apple.Foundation          	0x00007fff36a429e6 -[NSBlockOperation main] + 80
47  com.apple.Foundation          	0x00007fff36a42981 __NSOPERATION_IS_INVOKING_MAIN__ + 17
48  com.apple.Foundation          	0x00007fff36a41bb3 -[NSOperation start] + 722
49  com.apple.Foundation          	0x00007fff36a9c0dd __NSThreadPerformPerform + 204
50  com.apple.CoreFoundation      	0x00007fff343cade2 __CFRUNLOOP_IS_CALLING_OUT_TO_A_SOURCE0_PERFORM_FUNCTION__ + 17
51  com.apple.CoreFoundation      	0x00007fff343cad81 __CFRunLoopDoSource0 + 103
52  com.apple.CoreFoundation      	0x00007fff343cab9b __CFRunLoopDoSources0 + 209
53  com.apple.CoreFoundation      	0x00007fff343c98ca __CFRunLoopRun + 927
54  com.apple.CoreFoundation      	0x00007fff343c8ece CFRunLoopRunSpecific + 462
55  java                          	0x00000001052a7e56 CreateExecutionEnvironment + 886
56  java                          	0x00000001052a43d3 JLI_Launch + 1955
57  java                          	0x00000001052aa77c main + 76
58  libdyld.dylib                 	0x00007fff6e3c5cc9 start + 1

Thread 1:
0   libsystem_kernel.dylib        	0x00007fff6e509882 __psynch_cvwait + 10
1   libsystem_pthread.dylib       	0x00007fff6e5ca425 _pthread_cond_wait + 698
2   com.apple.Foundation          	0x00007fff36a4f41f -[NSObject(NSThreadPerformAdditions) performSelector:onThread:withObject:waitUntilDone:modes:] + 836
3   com.apple.Foundation          	0x00007fff36a4ef72 -[NSObject(NSThreadPerformAdditions) performSelectorOnMainThread:withObject:waitUntilDone:] + 124
4   java                          	0x00000001052a8844 JVMInit + 262
5   java                          	0x00000001052a5058 JLI_Launch + 5160
6   java                          	0x00000001052aa77c main + 76
7   java                          	0x00000001052a8cd5 apple_main + 84
8   libsystem_pthread.dylib       	0x00007fff6e5ca109 _pthread_start + 148
9   libsystem_pthread.dylib       	0x00007fff6e5c5b8b thread_start + 15

Thread 2:
0   libsystem_kernel.dylib        	0x00007fff6e509882 __psynch_cvwait + 10
1   libsystem_pthread.dylib       	0x00007fff6e5ca425 _pthread_cond_wait + 698
2   libjvm.dylib                  	0x000000010685b907 os::PlatformEvent::park() + 181
3   libjvm.dylib                  	0x0000000106835e44 ParkCommon(ParkEvent*, long) + 59
4   libjvm.dylib                  	0x0000000106836127 Monitor::IWait(Thread*, long) + 165
5   libjvm.dylib                  	0x00000001068365d5 Monitor::wait(bool, long, bool) + 121
6   libjvm.dylib                  	0x000000010697f6bb GangWorker::loop() + 101
7   libjvm.dylib                  	0x0000000106857863 java_start(Thread*) + 250
8   libsystem_pthread.dylib       	0x00007fff6e5ca109 _pthread_start + 148
9   libsystem_pthread.dylib       	0x00007fff6e5c5b8b thread_start + 15

Thread 3:
0   libsystem_kernel.dylib        	0x00007fff6e509882 __psynch_cvwait + 10
1   libsystem_pthread.dylib       	0x00007fff6e5ca425 _pthread_cond_wait + 698
2   libjvm.dylib                  	0x000000010685b907 os::PlatformEvent::park() + 181
3   libjvm.dylib                  	0x0000000106835e44 ParkCommon(ParkEvent*, long) + 59
4   libjvm.dylib                  	0x0000000106836127 Monitor::IWait(Thread*, long) + 165
5   libjvm.dylib                  	0x00000001068365d5 Monitor::wait(bool, long, bool) + 121
6   libjvm.dylib                  	0x000000010697f6bb GangWorker::loop() + 101
7   libjvm.dylib                  	0x0000000106857863 java_start(Thread*) + 250
8   libsystem_pthread.dylib       	0x00007fff6e5ca109 _pthread_start + 148
9   libsystem_pthread.dylib       	0x00007fff6e5c5b8b thread_start + 15

...

External Modification Summary:
  Calls made by other processes targeting this process:
    task_for_pid: 2
    thread_create: 0
    thread_set_state: 0
  Calls made by this process:
    task_for_pid: 0
    thread_create: 0
    thread_set_state: 0
  Calls made by all processes on this machine:
    task_for_pid: 16788
    thread_create: 0
    thread_set_state: 0

VM Region Summary:
ReadOnly portion of Libraries: Total=658.3M resident=0K(0%) swapped_out_or_unallocated=658.3M(100%)
Writable regions: Total=2.4G written=0K(0%) resident=0K(0%) swapped_out=0K(0%) unallocated=2.4G(100%)
 
                                VIRTUAL   REGION 
REGION TYPE                        SIZE    COUNT (non-coalesced) 
===========                     =======  ======= 
Accelerate framework               512K        4 
Activity Tracing                   256K        1 
CG backing stores                 1328K        4 
CoreGraphics                         8K        1 
CoreImage                           32K        4 
CoreServices                         4K        1 
Dispatch continuations            16.0M        1 
Foundation                           4K        1 
Image IO                           588K        1 
Kernel Alloc Once                    8K        1 
MALLOC                           220.8M      133 
MALLOC guard page                   32K        8 
MALLOC_LARGE (reserved)           4352K        5         reserved VM address space (unallocated)
Memory Tag 242                      12K        1 
STACK GUARD                        392K       50 
Stack                             55.1M       50 
Stack Guard                       56.1M       24 
VM_ALLOCATE                        3.3G      649 
VM_ALLOCATE (reserved)            32.0M        1         reserved VM address space (unallocated)
__DATA                            30.4M      320 
__DATA_CONST                        41K        3 
__FONT_DATA                          4K        1 
__LINKEDIT                       391.3M       15 
__OBJC_RO                         32.2M        1 
__OBJC_RW                         1892K        2 
__TEXT                           267.0M      317 
__UNICODE                          564K        1 
mapped file                       71.7M      130 
shared memory                      644K       16 
===========                     =======  ======= 
TOTAL                              4.5G     1746 
TOTAL, minus reserved VM space     4.5G     1746 

Model: MacBookPro15,2, BootROM 1037.120.87.0.0 (iBridge: 17.16.15300.0.0,0), 4 processors, Quad-Core Intel Core i5, 2.4 GHz, 16 GB, SMC 
Graphics: kHW_IntelIrisGraphics655Item, Intel Iris Plus Graphics 655, spdisplays_builtin
Memory Module: BANK 0/ChannelA-DIMM0, 8 GB, LPDDR3, 2133 MHz, SK Hynix, -
Memory Module: BANK 2/ChannelB-DIMM0, 8 GB, LPDDR3, 2133 MHz, SK Hynix, -
AirPort: spairport_wireless_card_type_airport_extreme (0x14E4, 0x7BF), wl0: Feb 28 2020 15:24:56 version 9.30.357.35.32.5.47 FWID 01-9ce4adf3
Bluetooth: Version 7.0.5f6, 3 services, 27 devices, 1 incoming serial ports
Network Service: Wi-Fi, AirPort, en0
USB Device: USB3.1 Hub
USB Device: USB Storage
USB Device: USB3.1 Hub
USB Device: USB 10/100/1000 LAN
USB Device: USB 3.1 Bus
USB Device: USB2.1 Hub
USB Device: USB 2.0 BILLBOARD
USB Device: Apple T2 Bus
USB Device: Touch Bar Backlight
USB Device: Touch Bar Display
USB Device: Apple Internal Keyboard / Trackpad
USB Device: Headset
USB Device: Ambient Light Sensor
USB Device: FaceTime HD Camera (Built-in)
USB Device: Apple T2 Controller
Thunderbolt Bus: MacBook Pro, Apple Inc., 47.4

I do not know where to go from here. Any help would be greatly appreciated.

On a side note, do I need to be able to run the SDK setup for me to use the Knime Core in my project?

Thank you.

Hi @asyrul21,

Welcome to the KNIME Forum, to assess your problem I need to ask you a bunch of questions:

  • which branch are you using in the sdk setup repository? I would not recommend you to use the master branch as it may contain unstable software, which can lead to the problem you are describing. Please try a release branch first.
  • Have you tried adding the -nosplash argument to the vm arguments in the startup configuration, there is a problem with some macs that is caused by the splashscreen.

best,
Gabriel

1 Like

I have had the same issue, @asyrul21, and adding this argument in the launch configuration has solved the issue for me!

1 Like

Dear @gab1one and @stelfrich,

Thank you for your replies.

I am using the 2019-06 branch - latest one, right before the master.

Okay so I added -nosplash to the vm arguments, but then I got ‘unrecognized command’:

unrecognized

So I tried adding the -nosplash at Program Arguments instead:

Now Knime runs, but it looks weird and ends up crashing with the Mac Spinning Beachball:

On the console, multiple java.lang.NullPointerException were thrown:

Screenshot 2020-07-01 at 21.47.52 Screenshot 2020-07-01 at 21.47.44

Hope we could work this out. Thanks!

That’s where it’s supposed to go. Sorry about the confusion!

Which Java version do you have selected as Execution environment in the launch configuration?

I have Java 13 initially installed on my machine, but just recently I installed the Adopt OpenJDK 8 (for Java 8) from here: Adopt Open JDK, selecting the Open JDK 8 LTS and the Hotspot options.

You can see the newly installed Java version is added to my root/Library/Java folder:
java

Now on my run configuration I set the Execution Environment to point to this newly installed Adopt OpenJDK 8:

On my Eclipse > Preferences > Execution Environments shows this:

I too suspect that my Java version might be causing the issue. I am not too well versed with Java and Eclipse, especially when it comes to their version conflict issues.

Any help would be greatly appreciated.

Thanks!

Have you tried clearing the workspace? Sometimes a faulty configuration prevents successful startup even after fixing the configuration because some leftovers need to be removed. Checking the “clear workspace” option will increase your startup times but also often fixes configuration-related problems.

2 Likes

Dear @CarlWitt,

I already tried clearing the workspace as well, it is still starting up with weird behaviour. I suspect this is due corrupted installation of my OpenJDK 8.

I will attempt to reinstall my java versions and update this thread soon.

Thank you

Hi! I am reproducing this issue on a new MacBook. I could start KNIME after disabling the splash screen but like reported the UI is now broken. I also had the same GC exceptions.

These are the original errors when using the KNIME 3.7 Target Platform from the branch releases/2018-12.

#
# A fatal error has been detected by the Java Runtime Environment:
#
#  SIGSEGV (0xb) at pc=0x00007fff66d4181d, pid=804, tid=0x0000000000000307
#
# JRE version: Java(TM) SE Runtime Environment (8.0_261-b12) (build 1.8.0_261-b12)
# Java VM: Java HotSpot(TM) 64-Bit Server VM (25.261-b12 mixed mode bsd-amd64 compressed oops)
# Problematic frame:
# C  [libobjc.A.dylib+0x681d]  objc_msgSend+0x1d
#
# Failed to write core dump. Core dumps have been disabled. To enable core dumping, try "ulimit -c unlimited" before starting Java again
#
# An error report file with more information is saved as:
# /Applications/Eclipse.app/Contents/MacOS/hs_err_pid804.log
#
# If you would like to submit a bug report, please visit:
#   http://bugreport.java.com/bugreport/crash.jsp
# The crash happened outside the Java Virtual Machine in native code.
# See problematic frame for where to report the bug.
#

I am attaching the full log.hs_err_pid804.log (54.8 KB)

Best,
Miguel

Sooooo …

I am having similar troubles here since updating to a 4.1 target platform and Eclipse 2020-12 running on macOS Catalina.

I am already starting this with the -nosplash option as recommended before (otherwise, it will crash immediately – but only if my MacBook’s lid is open. Digging deeper, Eclipse obviously has issues with the Mac’s “F-key” touchbar. I am really trying NOT to understand this.).

Fine. This way, the application will probably start successfully in ~ 25 % of the attempts. For the remaining 75 %, I’m now seeing this (amongst a plethora of other exceptions to which we’ve somehow gotten used to) and no UI appears at all:

java.lang.NullPointerException
	at org.knime.core.ui.util.SWTUtilities.markKNIMEShell(SWTUtilities.java:104)
	at org.knime.product.rcp.KNIMEApplicationWorkbenchAdvisor.postStartup(KNIMEApplicationWorkbenchAdvisor.java:168)
	at org.eclipse.ui.internal.Workbench.lambda$18(Workbench.java:2864)
	at org.eclipse.e4.ui.internal.workbench.swt.PartRenderingEngine$5.run(PartRenderingEngine.java:1105)
	at org.eclipse.core.databinding.observable.Realm.runWithDefault(Realm.java:336)
	at org.eclipse.e4.ui.internal.workbench.swt.PartRenderingEngine.run(PartRenderingEngine.java:1039)
	at org.eclipse.e4.ui.internal.workbench.E4Workbench.createAndRunUI(E4Workbench.java:153)
	at org.eclipse.ui.internal.Workbench.lambda$3(Workbench.java:680)
	at org.eclipse.core.databinding.observable.Realm.runWithDefault(Realm.java:336)
	at org.eclipse.ui.internal.Workbench.createAndRunWorkbench(Workbench.java:594)
	at org.eclipse.ui.PlatformUI.createAndRunWorkbench(PlatformUI.java:148)
	at org.knime.product.rcp.KNIMEApplication.start(KNIMEApplication.java:149)
	at org.eclipse.equinox.internal.app.EclipseAppHandle.run(EclipseAppHandle.java:196)
	at org.eclipse.core.runtime.internal.adaptor.EclipseAppLauncher.runApplication(EclipseAppLauncher.java:134)
	at org.eclipse.core.runtime.internal.adaptor.EclipseAppLauncher.start(EclipseAppLauncher.java:104)
	at org.eclipse.core.runtime.adaptor.EclipseStarter.run(EclipseStarter.java:388)
	at org.eclipse.core.runtime.adaptor.EclipseStarter.run(EclipseStarter.java:243)
	at sun.reflect.NativeMethodAccessorImpl.invoke0(Native Method)
	at sun.reflect.NativeMethodAccessorImpl.invoke(NativeMethodAccessorImpl.java:62)
	at sun.reflect.DelegatingMethodAccessorImpl.invoke(DelegatingMethodAccessorImpl.java:43)
	at java.lang.reflect.Method.invoke(Method.java:498)
	at org.eclipse.equinox.launcher.Main.invokeFramework(Main.java:653)
	at org.eclipse.equinox.launcher.Main.basicRun(Main.java:590)
	at org.eclipse.equinox.launcher.Main.run(Main.java:1499)
	at org.eclipse.equinox.launcher.Main.main(Main.java:1472)

Looking into above’s org.knime.core.ui.util.SWTUtilities.markKNIMEShell class where the NPE happens, the product is obviously null. (and looking at the comments there, someone else was probably shaking his head about the Eclipse universe):

I have no clue, why the product is null. Obviously, this only happens when launching during development from Eclipse and not when running KNIME standalone. Ok.

So, for now, I added a breakpoint in the markKNIMEShell method and just force escape it on each start, so that the NPE does not fly. This way, the KNIME-Eclipse monster finally comes back to life.

Any ideas what’s going on here? (gentle nudge at @quaeler whose name I found in the comments).

– Philipp

hmmm… merkwürdig / un peu bizarre / lame!

i haven’t worked with the modern Eclipse product, so i’m not sure - but a guess would be that something concerning the launch definition in your IDE is no longer considered proper by 2020-12? i’d have to believe that there are currently people in KNIME launching from Eclipse though - perhaps they had to update something when changing to 2020-12 and could provide some hints?

2 Likes

Hi @quaeler – wow, many thanks for getting back so quickly! Looking forward to hear any comments from other KNIME folks on this.

Best,
Philipp

Any feedback from @knime ? What setup do you recommend for developing on the Mac, or is the Mac platform out of KNIME’s target audience?

–P.

Hi Philipp,

I am sorry for the delay, we have been investigating this internally.

We updated the underlying version of eclipse with 4.2, which fixes the startup issues on macs. So you might want to try if the issue also appears with the 4.2 / 4.3 target platform.

The issue requiring the -nosplash argument was caused by a bug in eclipse rcp which got fixed with 2020-03 (the basis for 4.2 and 4.3).

Our mac based developers have not been encountering the 4.1 startup issue themselves, (besides the now fixed -nosplash issue). Is there a specific reason that is preventing you from targeting 4.2+ versions of AP?

best,
Gabriel

2 Likes

What setup do you recommend for developing on the Mac

Not an official recommendation, but I’m working with the following setup on a daily basis without any of the above issues

  • Mac OS 11 (Big Sur)
  • Macbook open all the time, with or without external screen
  • Eclipse 2020-09 and 2020-12 both work fine
  • AdoptOpen JDK 1.8.0
  • Nightly Target Platform
  • Source code from master branch
    (You may want to check out the releases/… branches when targeting an older release)
  • Double-check the Mac OS privacy settings
  • I added the following to the run configuration VM arguments:
    -Dequinox.resolver.revision.batch.size=10
  • Double-check that the product is selected


Hope that helps!
Thomas

2 Likes

Hi all,

thank you for your feedback, this is very appreaciated! Let me especially give @thomas_r’s recommendation a try during the weekend!

Is there a specific reason that is preventing you from targeting 4.2+ versions of AP?

We are currently committed to still ensure 4.1-compatibility of the nodes we provide b/c customers still tend to use these older versions. Our download statistics back this experience – there’s even still a significant pre-4.1 share in the download stats.

Anecdotally, from my own user’s perspective: I have become ruluctant to switch to newer versions due to several frustrating issues encountered recently (some obviously being specifically Mac-related, some more general).

I can still check if 4.2 or 4.3 solve these issues once I have plenty of time. I’ll be happy to provide feedback here and keep this thread up-to-date. If this is resolved on 4.2+: Great!

– Philipp