I hadn’t really got into using the Continental XLS Formatting nodes for my own work until about a week ago. They are a great extension to KNIME, but I just had not really had a need to format my output spreadsheets.
I’d tried to assist on the odd forum thread but never felt I could just go format a spreadsheet “on demand” without having to go back and re-read the tutorials or examples to remind myself how it worked. Even when I might have wanted to, I put it in the “too-hard” basket and decided that basic black and white was good enough, and any date formatting etc was easier to do by outputting strings in the desired format! (yeah… I’m basically lazy!)
… and then one day I did have a need, and the too-hard basket was not available… ![]()
I found myself wondering (yet again) how it all worked, and re-read some of the examples, and re-read the various old posts and I was left thinking, ok… that’s great but… where do I start next time I have an Excel formatting job to do, and no time to learn it all again… and I just want to make the heading bold?!
I read a couple of workflows (listed at the bottom) and I saw how it worked and it occurred to me that what I almost always wanted to do, if I am ever formatting table output, will be something like:
Make the headers bold
Make a currency column look like currency
Format dates a certain way
Perhaps do some banding of alternate data rows.
… and probably some other stuff.
The key was I just wanted all the hard work done for me. I didn’t want to have to do anything other than state what formatting I wanted.
So I decided that if I were going to have to do something like this time and time again, there was nothing for it and I was going to have componentize my requirement!
This component was going to have to automatically generate all the common tags I was likely to need directly from a data table, without me having to do any configuration. I did not want to have to tell the component anything. I certainly didn’t want to have to remember how or why it did what it did. I just wanted to drop it in my workflow and have it do it’s stuff.
You know what, actually it wasn’t so hard once I got into it, and this is the result…
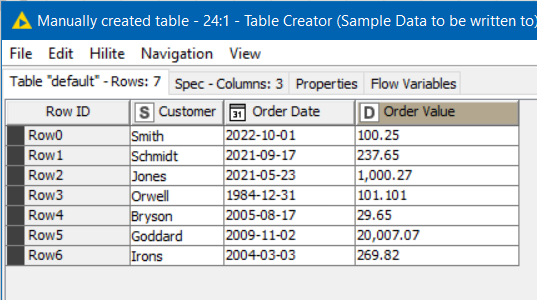
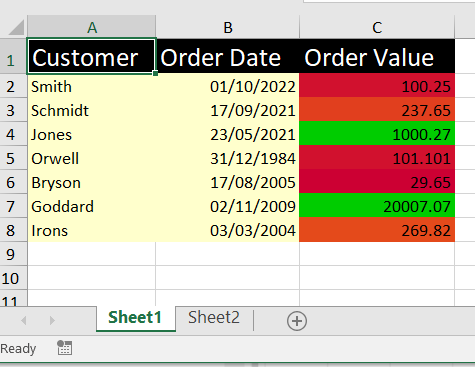
Given an input data table:
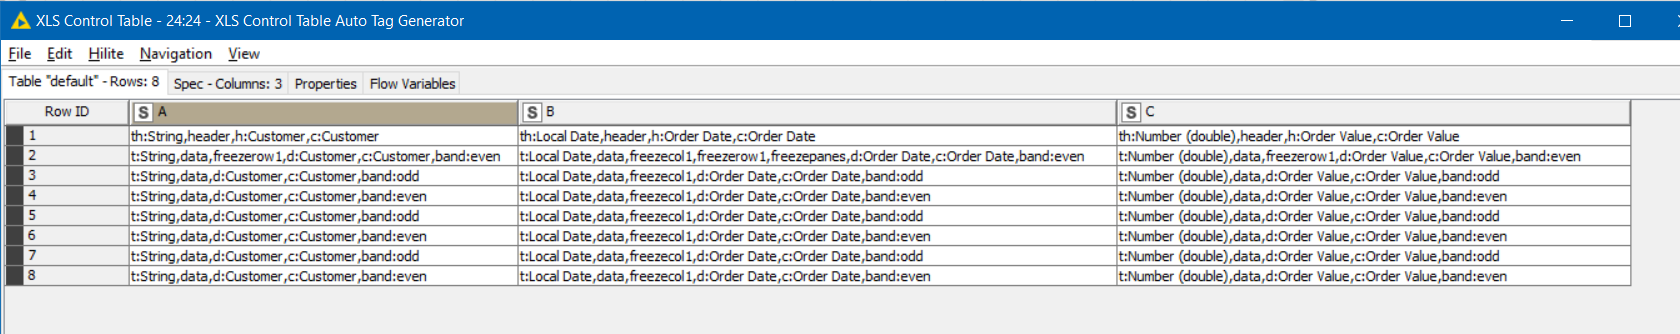
This component will generate all of the following tags:
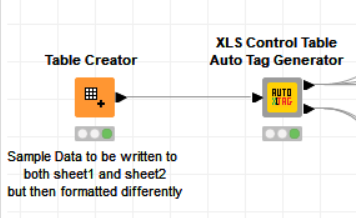
The uppermost output port is a “pass-through” of the data that came in, and can be sent directly to the Excel Writer. That’s just for convenience, and kind of a reminder that my flow still has to write the data in its raw form to Excel.
The lower output port is the control table that can then be passed to all of the required XLS Formatter nodes, and ultimately to the XLS Formatter (apply) node.
It doesn’t totally replace the XLS Control Table Generator node. If you still want to create other tags, then you would still use that, and then link it to the lower port of this component using an XLS Control Table Merger. This component “simply” wraps the XLS Control Table Generator (well actually four of them!) and does a load of what would otherwise be boiler-plate “no-code” on your behalf. But if you prefer, you don’t need to know any of that.
What the component automatically gives you are the following “tags”, so you can just get on and apply the formatting without thinking about the logic to construct the common tags that I certainly think I’d be wanting 99% of the time.
Header Row Tags: header, h:Column Name, th:data type, c:Column Name
Data Row Tags: data, d:Column Name, t:data type, c:Column Name
The prefixes were chosen to mean the following:
h: This is the header row for the given Column Name
th: This is the header row for data of a specific data type
d: This is a data row for the given Column Name
t: This is a data row of a specific data type
c: This a cell in a given column name (applies to both header and date rows)
Banding Tags: band:odd band:even
(denotes if data row is an odd or even number, Note that the first data row is counter-intuitively considered “even” because in Excel this will be row 2… )
Freeze Tags: freezerow1, freezecol1, feezepanes can be used to freeze just header (row1), the left-most column, or both
If you have other “generic” tags that you think are likely to be commonly required, please let me know.
I have uploaded a demo workflow to

A couple of things to note on this workflow.
First off, it uses another component “Pass-through” which can be safely ignored, and is not necessary for processing. It simply passes the supplied data straight through unchanged. It’s purpose here was to help me (in a very small way) keep the workflow slightly tidier.
I could have just uploaded the demo as this, and it would function just the same:
I kind of wish that the Continental nodes each had a “pass through” data port on them. That way they could easily be daisy-chained with the control table data passing through the top port, and the formatting data passing through the lower port. They’d look like a rail-track and the workflow would be much quicker to keep tidy. Just my thoughts.
Maybe there is a technical reason why that would be a bad idea…
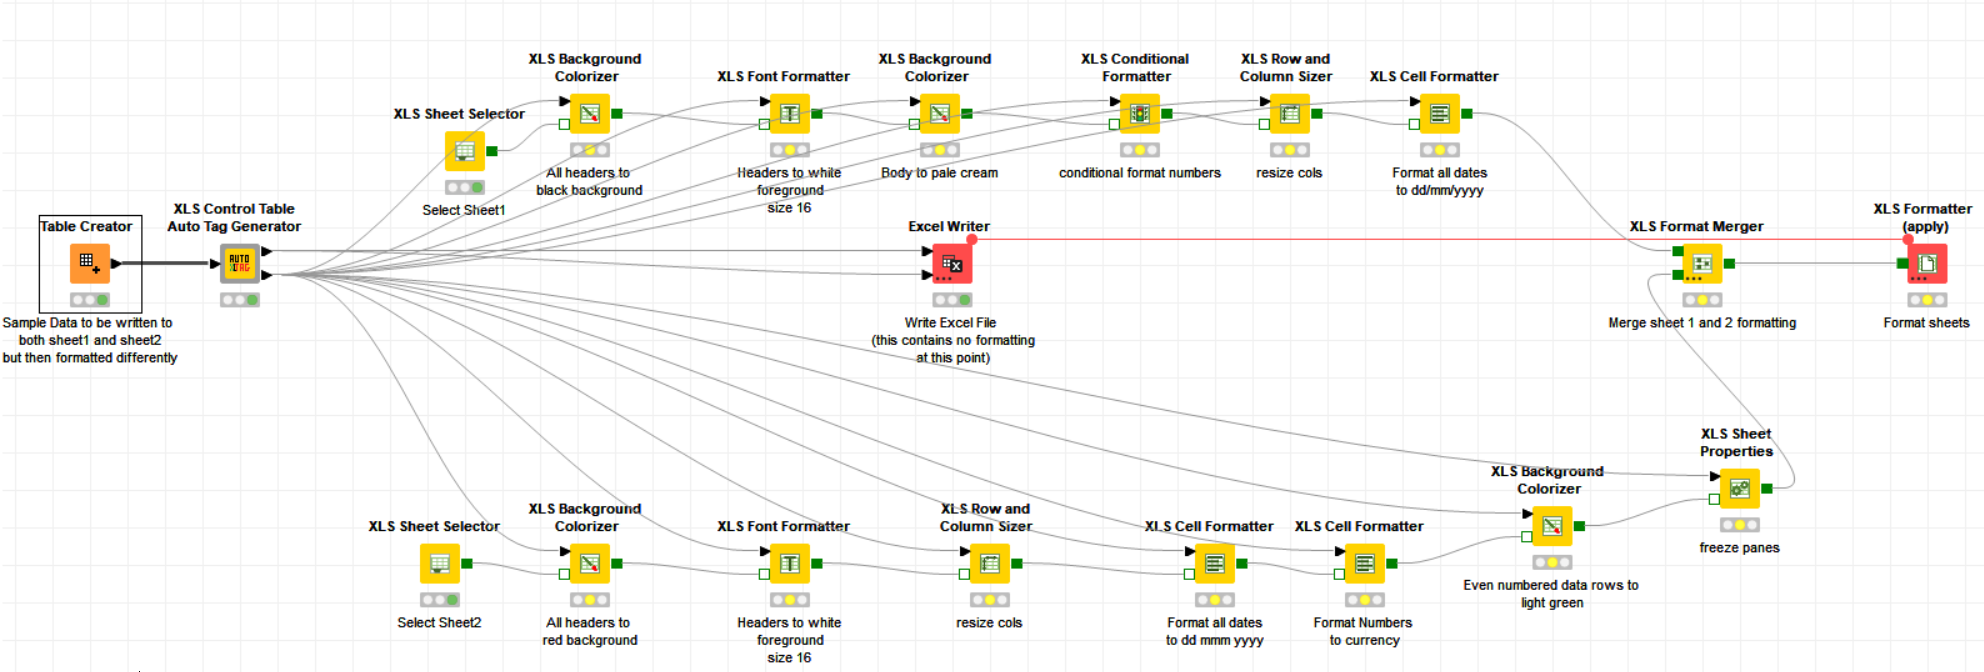
The demo workflow takes the sample data shown earlier and writes the data to two sheets in the same XLSX. The written data is identical.
These sheets are then formatted two different ways to demo some of the ways the tags can be used.
For those who are new to these nodes, put simply a tag identifies one or more cells on the resultant spreadsheet, and when you format a tag, the result is that all cells in the worksheet that are identified by this tag in the “control table” are given that format. You use the Excel Writer node to write out the spreadsheet as normal, and then apply the formats using the XLS Formatter (apply) node
Sheet1 gets some conditional formatting, but currency isn’t formatted whilst the dates are given dd/mm/yyyy format.
Sheet1
Sheet2 gets banded rows, currency formatting and a different date format
Sheet2
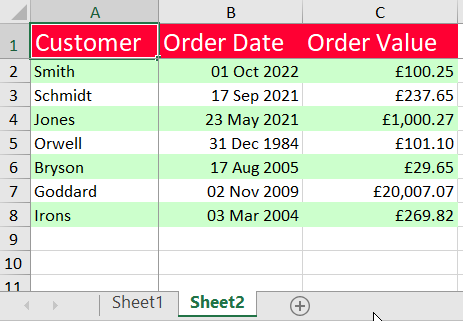
As you can see the money and date fields are formatted in different ways on the two sheets. The format of the “Order Value” column, for example is changed by formatting the auto-generated "d:Order Value" tag differently on each sheet.
e.g.

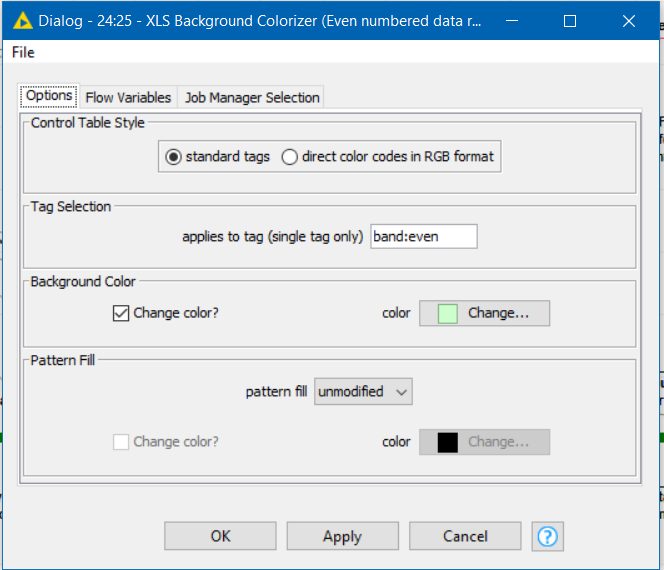
And on Sheet2, banding of the even numbered (using Excel’s row numbers) is coloured by specifying the format of the band:even tag
My intention is that for the most part the Continental Nodes can be used for formatting with almost zero knowledge of how tags work and no knowledge of how to create them. You auto-generate them, then you can inspect the lower data port and find the tag name representing the cell or cells you are interested in formatting (tags are separated by “,” as defined by the XLS Table Generator documentation)
Help in writing this component came among others from the following workflows, with my thanks to the authors of each, as their clarity helped me to work out what was going on and build this into something that I can use in future.
I primarily wrote it for me ![]() but I hope some of you might find this useful too!
but I hope some of you might find this useful too!