Hi @knime_admin
Is there a view as to when the parallel chunk loop end performance issue will be resolved. As soon as i hit large (>1M rows) the chunk end takes absolutely ages to finish and i not disk usage is sooo slow from knime.
much love
Gavin
Hi @knime_admin
Is there a view as to when the parallel chunk loop end performance issue will be resolved. As soon as i hit large (>1M rows) the chunk end takes absolutely ages to finish and i not disk usage is sooo slow from knime.
much love
Gavin
Hi @Gavin_Attard,
thanks for raising this again. I recalled and found our prev. conversations and it seems that, given how much time has passed, it is unlikely to happen. I suppose this is too specific, though.
However, I happen to have done some more in depth investigations in the past and found that Knime performs painfully slow when it comes to certain processes related to reading and writing data. The Parallel Nodes, as well as saving a workflow, falls right in that category.
CPU and Ram are almost never going to become a bottle neck but the disk certainly is. Even if I use a high performance SSD, directly hooked up to the CPU PCIe Lanes as a separate disk, Knime can become painfully slow.
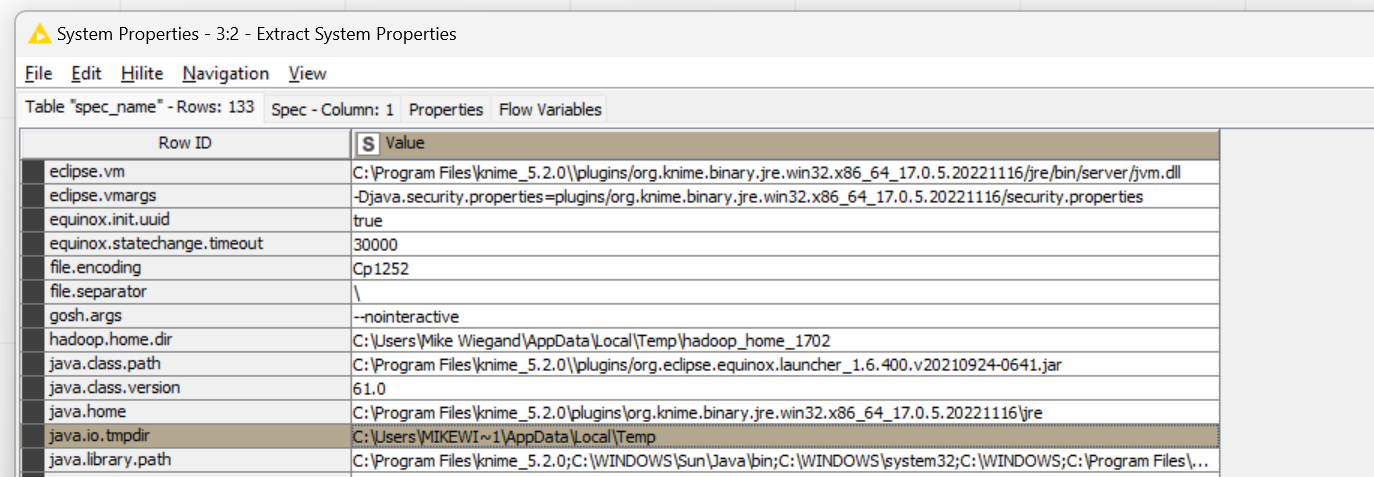
I.e. I noticed, when extracting the system properties, that the Java Temp dir is on the primary disk even if the workspace is not:
Anyhow, when saving or data is being collected like with the Parallel Chunk End node, SSD throughput is chilling at 6 % or less. To my dismay, no one felt this worthwhile having a look.
Best
Mike
Agreed i also think the primary issue here is disk i/o. Its not hardware related, defo software.
Fully agree. We could certainly rule out hardware limitations and I believe we concluded, backed up by the experiences of others too, that this regression started some version of Knime ago.
Regardless of the hardware, I also managed to rule out the backend type (row vs. columnar), compression of data during save (absolutely no CPU impact) and other things too.
The only continuity I see is large amount of data which I believe Knime is trying to sort. While reading the highly recommendable article from @mlauber71
Some args caught my attention like -XX:+UseStringDeduplication or -XX:+PrintGCDetails -XX:+PrintGCDateStamps -Xloggc:/path/to/gc.log. I wonder if there are processes like the string deduplication or garbage collection at fault causing the performance regression?
On second thought that would make sense as both I assume are not parallelizable using multiple CPU and the experienced issue scaled, gut feeling wise, linear with the amount of data. On top of that, it can be kind of replicated by triggering a garbage collection.
Eventually the flags in the article could help to increase log verbosity but without some support by the @knime_admin team we would just do guesswork.
Holy crap.
Have been months that i’m yelling to optimize performance over new features.
Loops in general, QOL improvements (like search for field in every nodes).
Knime is a wonderful swiss knife, but is struggling to be a very good ETL platform for such reasons.
Agreed, i had a client in the market, but i could not recommend it (they needed server), due to the write to disk times that are slowing everything down.
@knime_admin this really needs addressing
Hi,
On it, we hear you. We are currently working on at optimizing runtime of selected nodes, especially standard pre-processing nodes such as sorter, group-by, row filter, joiner. Some nodes have recently been updated, e.g. parallel CSV reading in 5.1, or pivot/groupby in 5.2 with less table scans. The changes to come mostly concern their implementation with regard to leveraging the columnar table API better. (There are more changes to expect in 5.3 - some nodes will skip unnecessary data scans for RowID checking and some nodes will also be optimized for use in streaming execution.)
We have chosen to prioritize those performance changes over the optimization of loops as more users will immediately benefit from the changes (note that it also benefits the node’s usage within loops).
Looking at loop optimization, especially parallel chunk loop (which is what this thread should be about), is also on the list but hasn’t started. There are some optimization we can and will do, which will mostly be around how often data is copied. E.g. the parallel chunk loop is currently copying the data at the input and the output. We will be able to eliminate one of the two, which should be doable with reasonable effort and I think I can promise this for the upcoming feature release also. The other copy is also on the list but will need to come later.
Thanks @wiswedel
I’m curious, when the parallel chunk is finishing off, i see between 0.5 to 1 Mbs disk transfer rate.
Is this due to the columnar API implementation? or is there something else to consider?
@Gavin_Attard same here too albeit not a direct client of mine they chose to abandon Knime in favor of another tool even though they have a few Knime servers running since years.
@wiswedel there have been so many changes in the past like the backend model, row vs. columnar, where I still struggle to see any speed gains, new visualization nodes, which were developed with an 80-20 rule in mind but lacking important basic functionalities, the “modern” UI which, even after way more than one year still lacks behind even the most simplest features such as a workspace search.
All this “distraction”, nodes being marked as deprecated but still being used and maintained (I refer to the lack of an upgrade process or guidance) causing cluttering in the node repository and certainly makes life for Knime-development challenging.
It really is painful to the heart to see this level of degradation with little clear vision. Yet there are challenges held to celebrate Knime (which I still love) but that makes me kind of nervous if that slow decline will become unstoppable at some point in the future.
I believe the team should focus on consolidating existing features and addressing reported performance issues, ensuring performance regression testing. If they do not, there is an uncontrolled risk of migration to other platforms. It would be a shame, as KNIME is a good tool.
Thinking about the issue I start to get a good picture of what might happens. The issue is described as follows:
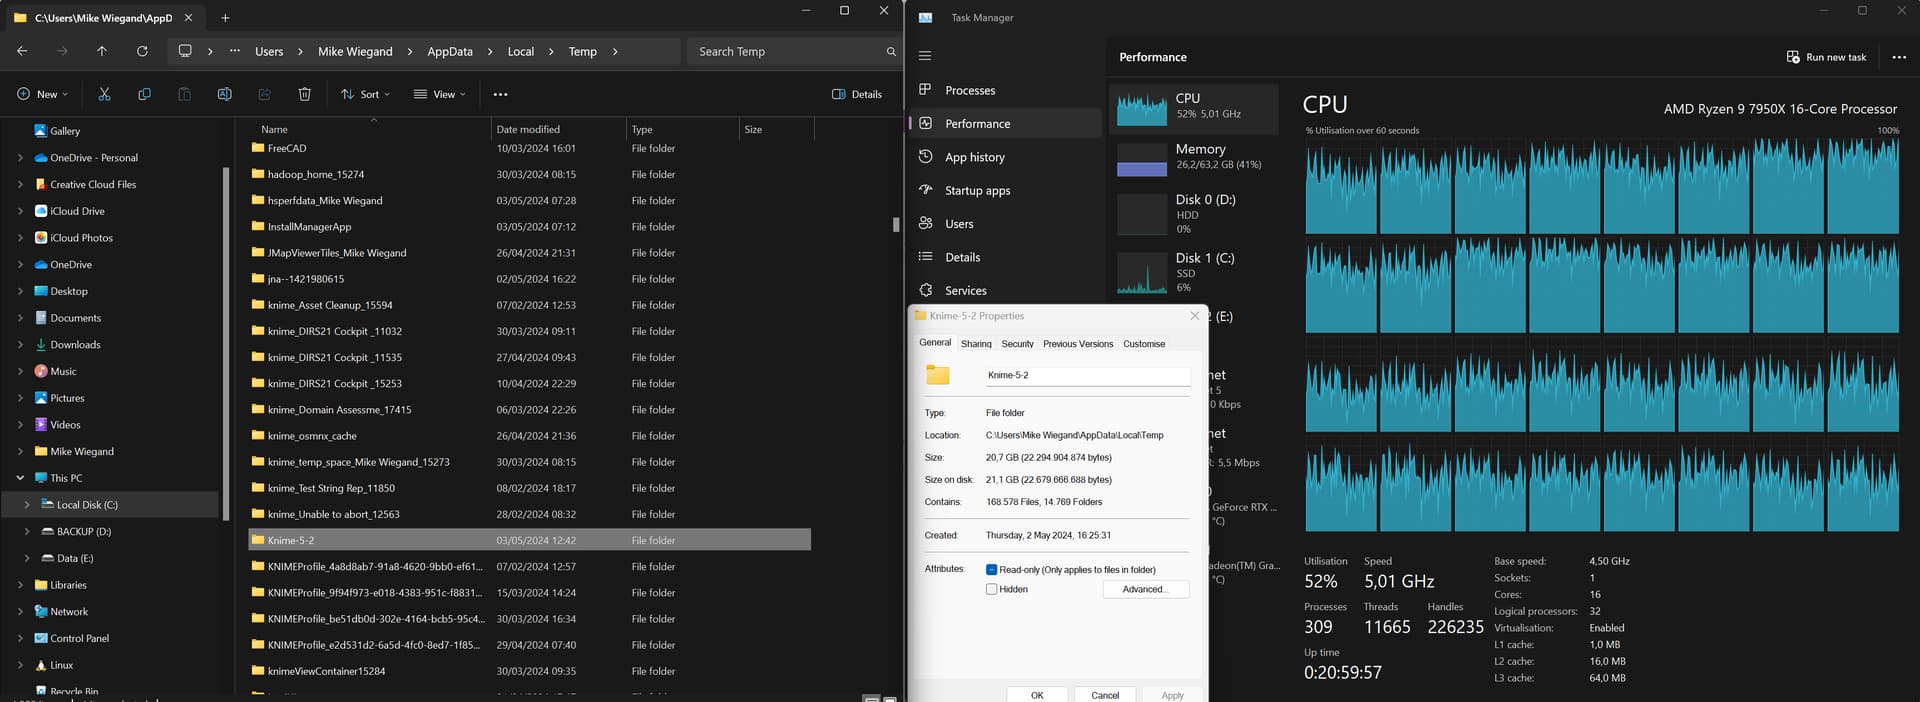
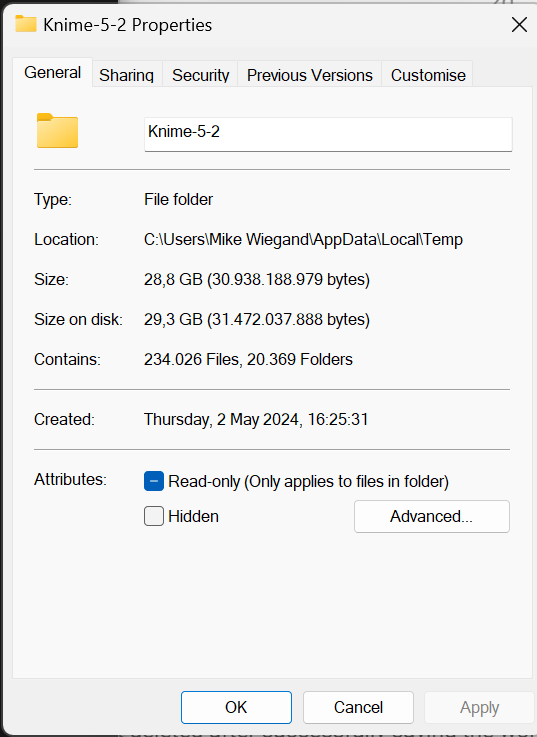
I currently have a crawl running and noticed, while also reporting some issues about the temp folder, that Knime creates “gazillions” of tiny files.
And just a “few minutes later” >60k files more:
Know, ask yourself, if you have that many files and the Knime data collection operation kicks in, any SSD, regardless how performant, won’t be able to provide its full read throughput. I believe, what I highlighted here, is so far the best contestant for a plausible explanation.
To test this hypothesis, we’d need a workflow (which I started to create some time ago), to reliably create a scenario where Knime creates a lot of temp files. What do you think?
Related post
Best
Mike
We spent more time on reviewing the Parallel Chunk implementation. There are two issues as far as we can tell:
It seems (1) is only affecting the Columnar Backend (and has never worked for the Parallel Chunk Node). The code change seems relatively easy/safe, so we will fix this for 5.2.4 (due this month). I have created and uploaded an example workflow that illustrates the execution time for a 50M row table (execution time for the entire loop is reduced from ~200s to ~65s): AP-22457_ParallelChunk_LoopPerformance – KNIME Community Hub
(2) is more involved and requires some changes to the KNME core parts, which is why it’s currently scheduled for 5.3 (~July). With that change in place we can expect the execution to drop to 30s.
@mwiegand , I don’t think that these issues relate to the many files issues you reported above. Ideally we can discuss this in a separate thread (separate concerns).
– Bernd
Hi @wiswedel,
awesome, thanks for your feedback the taking the time to dive into and find fixes for the issues ![]()
The issue about the many files being create is almost certainly caused by the Network Dump nodes, which re still in beta, from Selenium. Please feel free to ignore that as, after removing them, the issue got temporarily fixed.
Just out of curiosity, in regards to testing row vs. columnar backend, which steps would you recommend to execute to properly test an issue against both scenarios?
Best
Mike
In my workflow above, I was just using standard settings and comparing runtime for both, row and column backend. I used two components (here) to measure execution time. Nothing fancy and also did not try to tune any other settings, such as memory.
Internal ticket ID: AP-22457
Fix version(s): 5.2.4, 5.3.0
Other related topic(s): -