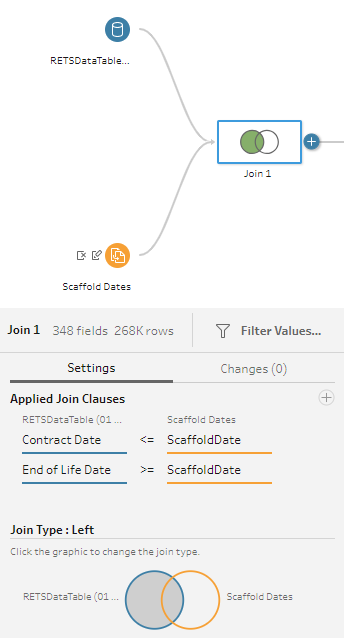
I’ve dealt with two date problems in the past in Tableau, but would like to bring it into KNIME.
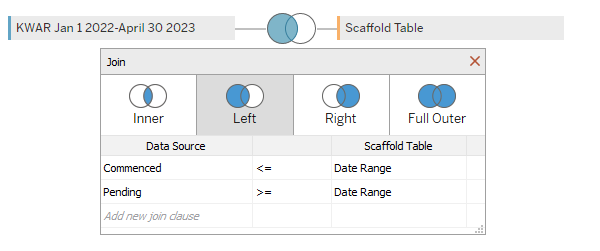
In essence, I have a 3 column table (actually 300+. but let’s assume there are just 3 ): unique ID, start date, and an end date. The solution in the link above requires a 3rd column to link the dates. In Tableau, I arrive at this similar to the solution above with a Left + Inner Join with <= and >= join operations on the start and end dates, respectively. For example:
The joins in Tableau work similar to the Joiner node in KNIME, but how do you execute the <= or >=?
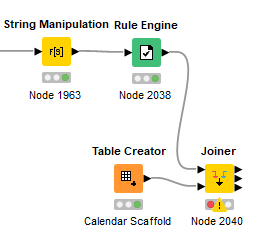
So far in KNIME I have my main data table (outputting last from the Rule Engine node pictured), and a secondary stream with the Calendar Scaffold (a simple range of dates from 2019 to 2026) - both ready to perform a join, but the joiner node seems to operate only on = basis.
Unfortunately, as you have found, the KNIME joiner nodes don’t currently support non-equi joins. It would be good if one day they do, and I would encourage anybody reading this to go vote on @iCFO 's post in “feedback and ideas”
In the meantime, this “missing feature” has generally meant a number of alterative solutions being proposed. I’ve listed some options below. There may be other alternatives I’ve not considered.
The cross-join and filter solution
One solution to this relatively common problem involves performing a cross join between the tables, followed by a rule engine or rule based row filter to then perform the row matching. This is the approach taken here:
The Binner (Dictionary) Solution
This is not an area I have particularly good knowledge on, but it would be remiss of me not to mention it, as I know it often comes up as a proposed solution to this type of problem.
An example of its use can be found here,
but I’ll leave it to others (@Daniel_Weikert ? ) to demonstrate that one if you want to know more, lol!
The Python pandasql solution
Another possible solution, if you have python installed is to write the data tables into pandas dataframes, and join using pandasql.
This was the basis for an early component I wrote to provide a possible solution, and is demonstrated in the following workflow on the hub:
The looped row-filtering solution
This was a more challenging approach involving looping through the rows on a smaller “lookup” data set and then performing a cross join and row filter on the primary data set with each row in turn. This has the benefits of not requiring the “exploding memory” of a full on cross join where larger datasets are involved and doesn’t suffer “datatype” compatibility issues of the H2 solution. However it is much more complex to write and in most circumstances probably slower. However, theoretically, there may be a point at which it out-performs other solutions if available machine resources are limited. It was the approach used in one of my joiner components on the hub the “Regex Lookup Filter Joiner”.
The local (H2) database solution
My final proposed solution, which is similar to the pandasql idea, but not requiring python is to involves wiring the data to a local sql database such as the H2 database that is available out of the box with KNIME and then performing the join with SQL, and this is my preferred general solution, but there are some limitations because to do this, the tables you are joining need to contain only datatypes that can be inserted into H2 tables. The workaround if they don’t is that use column filters to return a pair of tables containing just the key fields that you want to non-equi-join on, use the component to join those and then join the resultant keys back to your original tables to pick up the remaining columns. With large numbers of columns, it may be better to join together tables containing just the key columns anyway, for performance reasons.
This was also a solution discussed in @mlauber71’s Hub article:
Rather than having to build the additional logic every time, the above have H2 database solutions been turned into components available on the hub and which are described in the following post, which I hope you will find useful:
@takbb - thanks very much for the helpful primer here. Surprised there isn’t a native approach already, given that Tableau has it natively despite overall weaker prep functionality.
The avenues you presented gives me some thoughts. I like the H2 and Python approaches, though I’m using SQLite for the DB but I do also have python installed. I was going to also wonder if there were community nodes available, so I’m glad to see that you have already developed one.
Will give one of these a shot.
Update
Guessing PandaSQL is operationally intensive? Have had it running now for about 5 minutes on a 200,000 row data set. Still running. The code for the left-inner join I used is:
SELECT *
FROM t1
LEFT JOIN t2 ON t1.‘Contract Date’ <= t2.‘Scaffold Date’
AND t1.‘End Of Life Date’ >= t2.‘Scaffold Date’
@takbb Thanks a lot for associating me with the binner. I believe your examples are already great (especially your components) and I really like the database idea as well.
As always a great contibution to the KNIME community
br
Thanks again all - so I think I’ve arrived at a solution that mixes @takbb’s python-based and @mlauber71’s database-based join approaches. However, myself being neither an expert at either python nor databases, I’m hoping to get a hand in seeing why I’m only getting 2 rows out of 100K+ in my output.
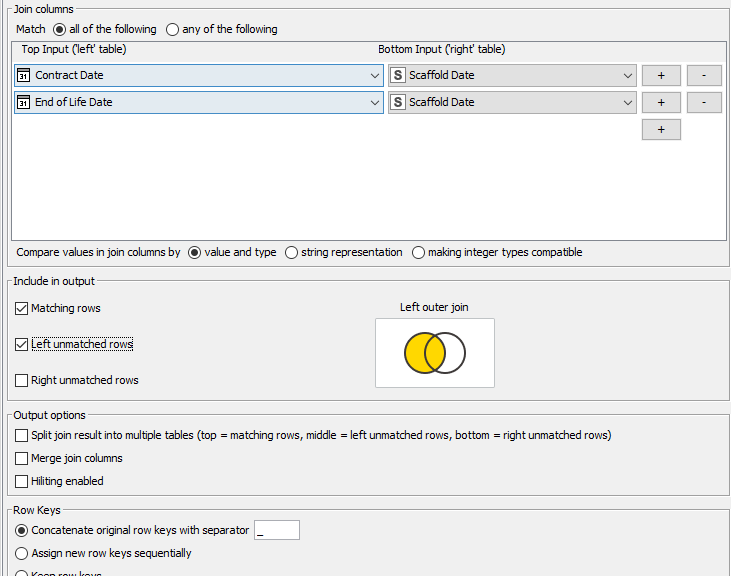
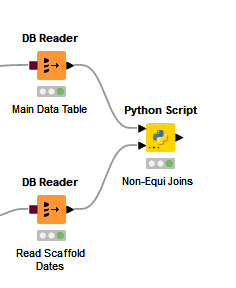
First, here’s the workflow excerpt, which simply takes the main data table from the left side, and the scaffold dates on the right side:
Here’s the python script:
import knime.scripting.io as knio
import pandas as pd

# data from KNIME to Python (pandas)
df = knio.input_tables[0].to_pandas()
df1 = knio.input_tables[1].to_pandas()

# Convert KnimePandasExtensionArray to regular Series
df['Contract Date'] = pd.to_datetime(df['Contract Date'])
df['End of Life Date'] = pd.to_datetime(df['End of Life Date'])
df1['Scaffold Date'] = pd.to_datetime(df1['Scaffold Date'])

# Perform the left join with filtered Table 1 and Table 2 using pandas merge
output_table = pd.concat([df, df1], axis=1)
output_table = output_table[
    (output_table['Contract Date'] <= output_table['Scaffold Date']) &
    (output_table['End of Life Date'] >= output_table['Scaffold Date'])
]

# data from python (pandas) to KNIME
knio.output_tables[0] = knio.Table.from_pandas(output_table)
My suspicion is perhaps the python code is doing this across the entire column, irrespective of the Listing ID (not pictured), and thus of the 119K rows, it finds only 2 rows. Each row has a Listing ID field that is a unique identifier, and at this point in the ETL a Listing ID won’t be shown twice (so only 1 row for each).
Hi @qdmt , it’s difficult to determine what is wrong without seeing the actual data, and maybe you could share a small sample of the data from both tables - with sufficient rows that at least a few of them should join - (with anything sensitive removed)?
I have a question though. I see now that your two data sources are coming directly from database queries, so are your two tables on different physical databases? If not, a sql query to perform the required join in the database would be more efficient.
I can see that the components would not be that quick on datasets of any size because they don’t have any indexing on the data, and it is the processing of the condition that takes the time I think.
As a side note, that has given me an idea for a performance enhancement on the “Join Custom Condition” though (the one that uses the H2 database). The fact that it uses H2 should not matter even though you are using SQLite for your database, because its use within that component is effectively a “black box” and doesn’t need anything special to make it work.
lol… @Daniel_Weikert I associate you with some very useful insights and contributions on the forum, but by my calculations, given that I have exactly zero workflows on the hub involving binner, and you have at least one, that makes you infinitely more experienced on the binner than I am
@takbb See I have to focus on the niche as everything else is already well covered by you
Anyway, I always enjoy reading your solutions and learn something new
br
@qdmt, I wonder if this new component would be more performant:
Link your tables as in your diagram with Main Data Table at the top, and Read Scaffold Dates at the bottom.
Specify the condition as :
t1."Contract Date" <= t2."Scaffold Date"
and (t1."End of Life Date" >= t2."Scaffold Date")
NB, the case of the t1, t2 and presence of the double-quotes is important for the performance improvements. See the documentation on the component
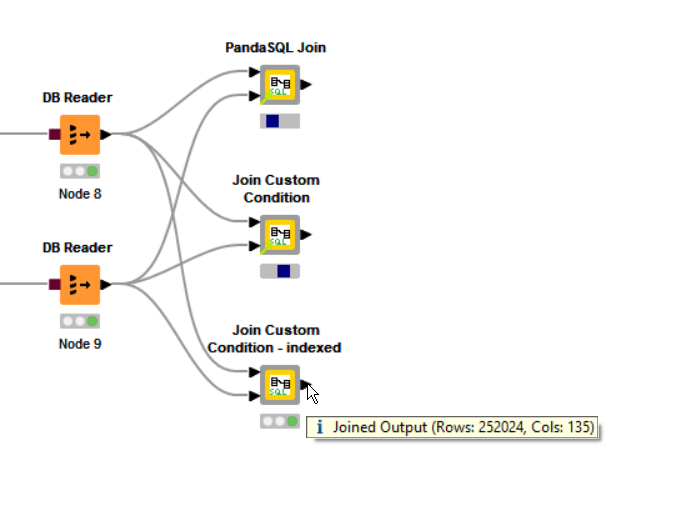
It won’t be instant, but if it behaves itself properly, I am hopeful that this should return to you in significantly less than 5 minutes. On an equality join between a 190k row table and a 250k row table, on my laptop, I tried the PandaSQL join, the original Join Custom Condition and the new Join Custom Condition - indexed
Awesome, thanks @takbb - let me give this a shot. Quick answer to your question on where the tables are - yes they are in two different DB’s. I’ve found myself recently with a need to have a generic DB containing “public use” tables, such as this scaffold dates, latitudes, longitudes, zip codes, etc.
I will try to get a generic table I can share if I still have trouble. I’m in that halfway point of the “is this quick enough to solve that I don’t need to generate a dummy table, or is it not that quick that I should” conundrum.
Update
Had trouble using the new component. Says: Execute failed: Error while adding rows #-1000 - #0, reason: Value too long for column “Remarks”
…but that column is in the exclusion list. On the Left, I tried with either just the 2 columns (Contract Date, End of Life Date), or 3 columns (with ML Number included).
Might be time I try to get a dummy dataset together.
Side thought on the “two date problem”. The two date problem and the classic solution (at least the one implemented here or outlinedhere) has a Start Date field and an End Date field, both of which are connected to a Scaffold Date.
If in between a Start Date and an End Date we also have a Suspended Date and an Unsuspended Date, do those (un)suspension dates also need to be joined to a Scaffold Date?
Ok, not at my pc now but I’m guessing the component tries to load all the columns into the local database but only returns those requested.
I can’t recall if there was a reason for doing it that way, but it probably can be fixed. I’ll take a look tomorrow. In the meantime a workaround would be to filter the columns down to just the key columns that you need from both tables, then join those in the component and finally join the result back to the original tables to bring back the full set of required columns.
Re your question on additional un/suspension dates, I don’t know what their purpose is so I don’t know what additional joins would be required. Can you elaborate, and give some examples?
Sharing sample data as I’ve crossed that threshold
Maybe I’ll take a step back and describe the context further: Context
Have an ETL workflow that handles real estate listing information and uploads to Tableau Cloud for visualization. The workflow automatically scans a folder daily for the latest csv file of real estate listings. The workflow parses the data into two SQLite tables: a historical table, and a current table. It is the current table that gets uploaded to Tableau Cloud.
Challenge
Each listing has an ID, and multiple dates (i.e., a start date, sold or terminated date, updated date, suspended / unsuspended date, etc.). To be able to compute the # active listings across a time period, one needs to be able to count the periods between the dates, regardless of drill down level (i.e., year, month, week, day).
What I had done previously in Tableau was to create a separate table, a Scaffold Table, which is a simple series of dates, and performed a cartesian non-equi join of every start date and every join date to a Scaffold Date. So for every listing, it would be replicated for the number of days after or equal to its contract date, but less than or equal to its end of life date.
Basically, the scaffold date creates a common calendar (and thus common axis) for all dates.
Approaches
Can continue with the old approach, but I would have to open Tableau each day to run the join the join with the scaffold table.
Transport approach to KNIME so I can keep things automated, hence this thread.
Potential Issue
The one thing I’m realizing now is that cartesian joins are incredibly taxing. I’m not sure if it’s a good idea anymore to replicate the number of listings for the number of dates in between a period, especially when 3 months of listings is already 120K+ rows (and that’s unique rows btw - not counting a listing’s historical rows). So if an average listing was active for 15 days, I’d be multiplying that dataset by that much.
Hope that and the attached dataset helps - can add in any additional columns from the original table if needed.
Hi @qdmt, I think I get the rough idea of what you are trying to achieve, but obviously I don’t have your two data sets so I cannot experiment with how they would join.
I have updated the Join Custom Condition - Indexed on the hub to fix a couple of bugs that I found, and also to further improve its abilities. It should no longer cause trouble with the additional columns that are not being used within the join condition as it now takes the approach of only uploading those columns required for “joining” plus rowid to the internal database. There is a trade off here though, as this means it has to subsequently perform further joins to bring the other columns back so that the original data can be returned, but it makes it a little more robust.
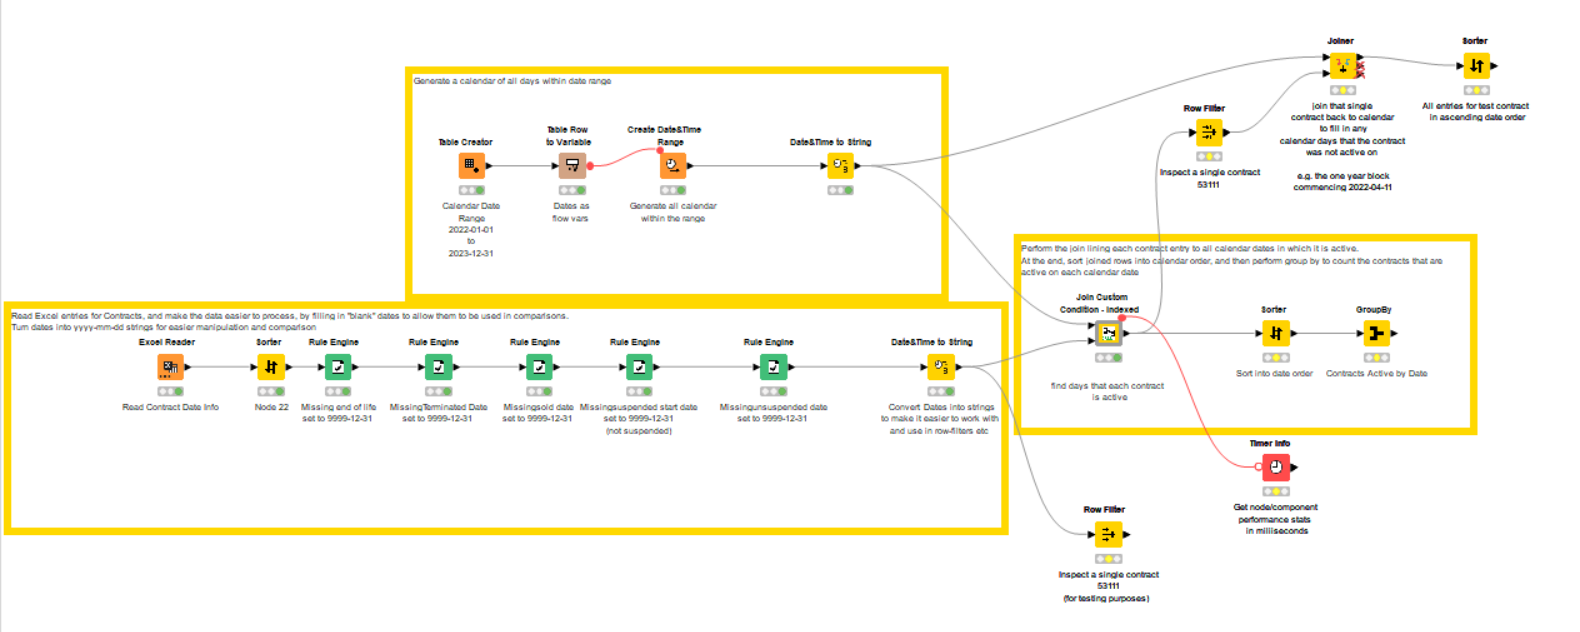
I put together the attached workflow as a demo, rather than to necessarily solve your specific problem.
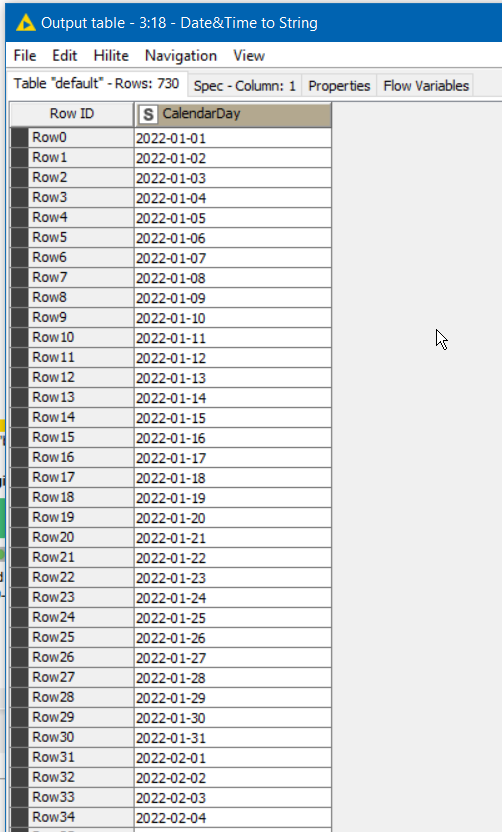
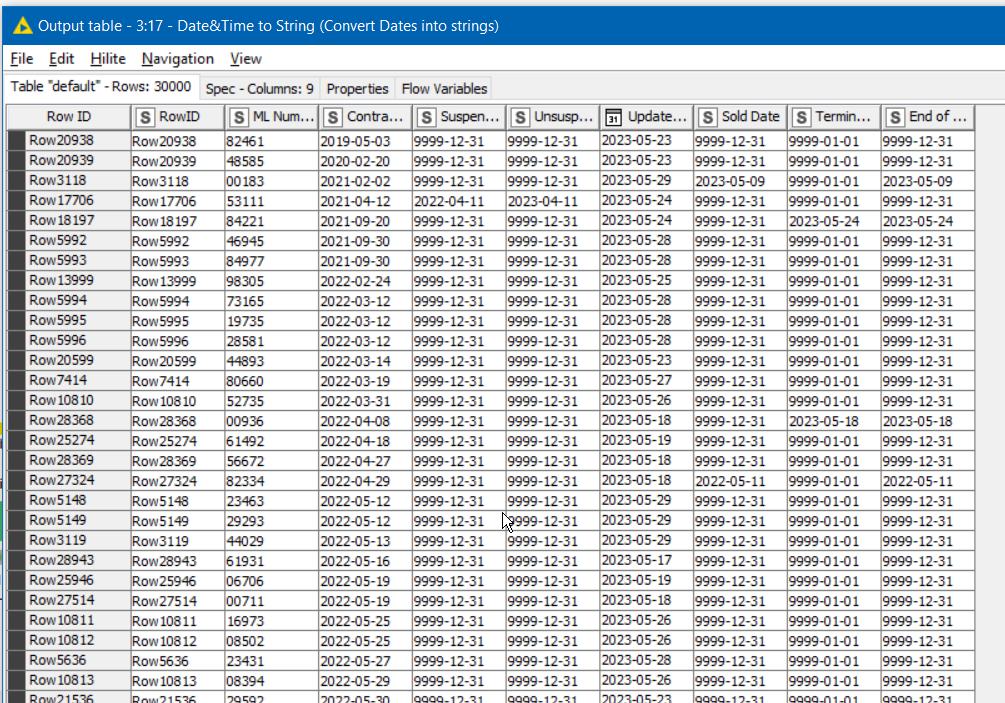
The Excel spreadsheet you supplied is read, and for ease of processing, missing dates that are to be used in comparisons are set to 9999-12-31, and again turned into Strings for comparison purposes:
I can’t guarantee there are no errors in my logic, and I don’t know if this is close to the kind of thing you are trying to achieve. As the date range increases, the time to process increases too. A date range of 4 years will probably take closer to 5 minutes to process, but this is significantly better I think than the previous joiner components.
Very cool - much appreciated on you and your time in helping me think through this. Will give this updated approach a shot.
Quick FYI (no impact to what you presented I think) - the End of Life Date is actually a column I created to consolidate a common “end milestone”, as a particular ID can either have a sold date or a terminated date (but never both, so in another part of the workflow I grabbed the non-null of the two). I’ll update the Join logic accordingly and try this.
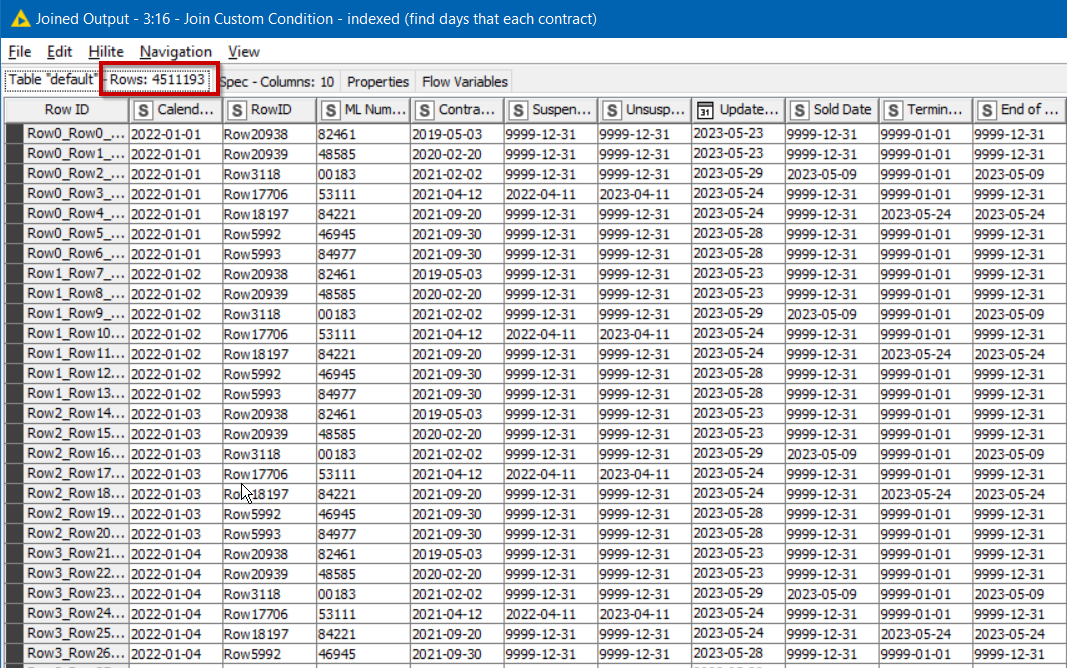
4.5M rows seems right if dataset has more ID’s that have been active for longer.
Timed it at 4m13s on my PC (Win10, i7-7600U CPU @ 2.90GHz, 16GB RAM, 64bit).
The main data table had 119K rows which expanded up to only about 216K rows, surprisingly. But the dates seemed correct. The join condition for the first test was:
t1."Scaffold Date" >= t2."Contract Date" and
t1."Scaffold Date" <= t2."End of Life Date"
The fields used were the unique ID, contract date, and EoL date on the one side, and the scaffold date on the other (the calendar dates). I didn’t include the (un)suspended in the join logic as I realized it would prematurely cut the scaffold range short (as the EoL Date is the “final” tombstone date, so a not>Suspended condition would cut the scaffold dates after that suspension date).
Many many thanks - now to see if Tableau can handle the new performance demand
update may have spoke too soon. Seems that the Left Unmatched isn’t working as expected (the ID’s without EoL dates are excluded). Still evaluating to see if I missed something.
Last (hopefully) edit: I think we’re good. I followed up Join Custom Condition with a traditional Joiner to bring back the unmatched / still open (i.e., no EoL date), and that should do the trick.
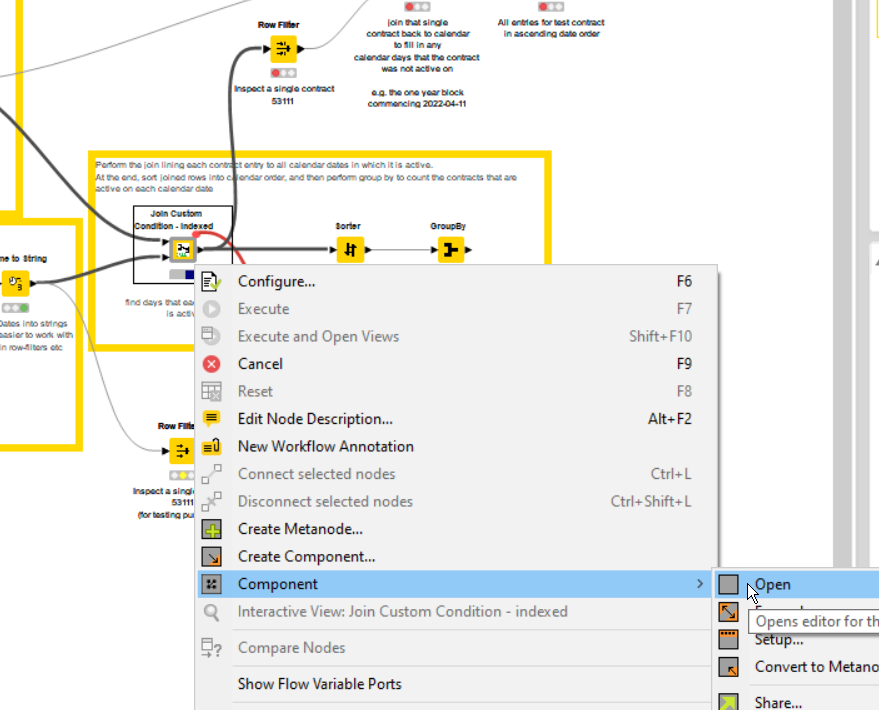
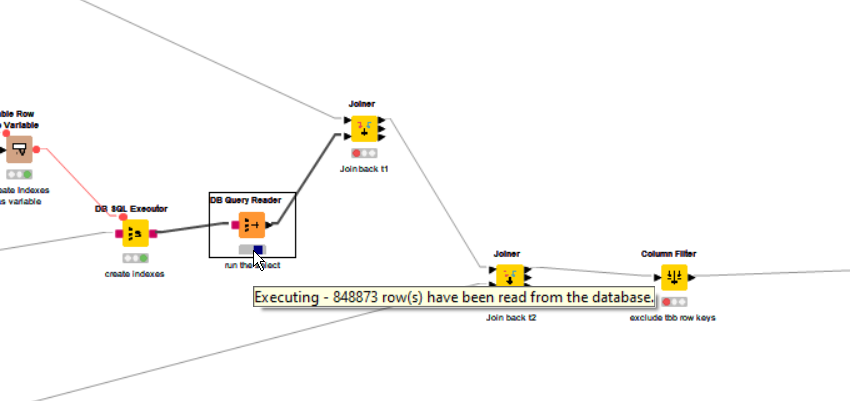
Just as a side note… you may already be aware of this but whilst it isn’t possible for a component to provide ongoing “progress”, when it is executing, you can always “peek inside” if it is taking a while.
Just “open” the component and take a look at the nodes to get a feel for how it is progressing (i.e. whether it is taking a while performing the db query, or the subsequent joins back to the original data sets.)
For the standard “joiner” nodes, you’ll just see the percentage indicator (I found they actually form part of the bottleneck on large data volumes), but for the DB Query Reader, hovering the mouse over it will often show some information as it executes, such as rows that have been read).
When I tried your flow I ran into an error
Did you experience something similar by any chance
“DB Writer Output type mappings are missing for columns”
KNIME 4.7 and I just run the downloaded flow
br
Thanks @takbb - I knew of opening the component, but hadn’t thought to check the progress yet within. The nodes within are like the Quantum Realm for me, so I have it marked for study later on .